Unit 15 · 38 min read
Advanced Risk Management.
Risking a fixed percentage per trade is the start, not the finish. This unit covers what per-trade risk misses: currency overlap between pairs, stacked open risk, stops that change size as volatility changes, the asymmetric maths of drawdowns, and how many losers in a row your account can survive. Where it helps, the numbers are applied to the loss limits on OA Funded.
- Level
- Intermediate
- Revision
- mentor-2026-10
- Access
- Public
By the end, you can
- Measure currency exposure across open positions instead of counting trades
- Calculate portfolio heat and set a personal cap below your account's daily limit
- Size positions from a fixed dollar risk and a volatility-based stop
- Use the drawdown recovery formula to see why deep drawdowns are hard to repair
- Estimate how many consecutive losers your risk per trade allows before a floor
Per-trade risk is only the first layer
By now you size every trade so a stop-out costs a set slice of the account. Good. That habit alone puts you ahead of most new traders. But it answers one question: what can this trade lose? It does not answer the question that actually ends accounts: what can everything I hold lose at the same time?
Accounts rarely die from one oversized trade any more. They die on the day three sensible-looking trades all turn out to be the same trade, or the day volatility doubles and a familiar lot size quietly risks twice what you planned. This unit is about those days.
Most of what follows applies to any account. Where it helps, we apply it to the limits on OA Funded: a daily loss limit of 5% of the initial balance and a static maximum loss floor at 90% of the initial balance, both checked against equity including open trades.
Pairs are not independent
Every forex trade is two trades: long one currency, short another. Buy EUR/USD and you are long euros and short dollars. Sell USD/CHF and you are short dollars and long francs. Different charts, same dollar bet.
Correlation measures how closely two pairs move together, from +1 (always the same direction) to -1 (always opposite). EUR/USD and GBP/USD often run strongly positive. EUR/USD and USD/CHF often run strongly negative, which means long one and short the other is a doubled bet, not a hedge. Correlations also shift with risk sentiment, central bank policy and big news, so check current readings rather than trusting last year's.
Indices behave the same way. Two US stock indices tend to move together, and on risk-off days they can drag risk-sensitive currencies with them. Your watchlist may look diverse while your exposure is one idea: 'the dollar weakens' or 'risk is on'.
The practical fix: before each new trade, write your open exposure by currency, not by pair. If a new trade adds to a currency you already lean on, either skip it or split your normal risk across the related trades.
Worked example
Three trades, one bet
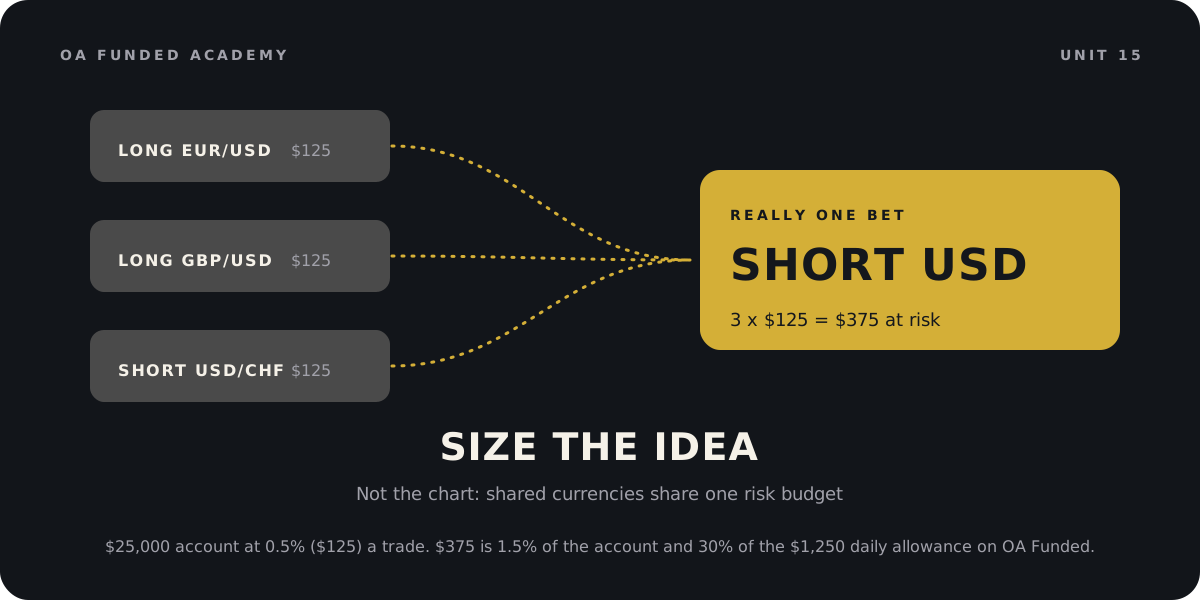
A $25,000 account. You risk 0.5% per trade, which is $125. You see three clean setups: long EUR/USD, long GBP/USD and short USD/CHF.
- Write exposure by currency. All three trades are short USD.
- If US data comes out strong and the dollar rallies, all three can hit their stops in the same hour.
- Combined loss: 3 x $125 = $375, which is 1.5% of the account, on one idea.
- On OA Funded, the daily loss limit on a $25,000 account is 5% of the initial balance, $1,250. One bad dollar hour has used 30% of that day's allowance.
- Alternative: treat the three as one trade and split $125 across them, about $42 each. If the dollar idea is right you still profit across all three. If it is wrong you lose $125, as planned.
Takeaway: Size the idea, not the chart. When trades share a currency, they share a risk budget.
You are long AUD/USD and long NZD/USD, each risking 0.5%. You want to add long EUR/USD at 0.5%. What is the clearest description of your exposure if you add it?
Portfolio heat: the number you check before clicking
Portfolio heat is the total you would lose if every open stop were hit right now. Add the dollar risk to stop on each open position. Add any loss you have already taken today. That total is your real exposure for the day.
Set a personal heat cap and write it in your plan. A common starting point is two to three times your per-trade risk. If you risk 0.5% per trade, a 1.5% heat cap means at most three full-risk trades open together, fewer if they overlap.
On OA Funded, compare your heat with your room: current equity minus the higher of the daily floor and the static floor. Heat should always be well inside room. If heat plus a normal slippage allowance would cross the floor, you are not allowed a new trade, whatever the setup looks like.
Stops are not guarantees. Fast markets can fill you worse than your stop price. Leave a buffer. A simple rule: assume each stop could slip by a quarter of its distance on a high-impact news day, and make sure your heat still fits.
Volatility changes what a lot size means
A fixed lot size feels safe because it is familiar. It is not. If you trade 0.10 lots with a 30-pip stop in a quiet week, then the market wakes up and your stop needs to be 60 pips to sit beyond the noise, the same 0.10 lots now risks twice as much.
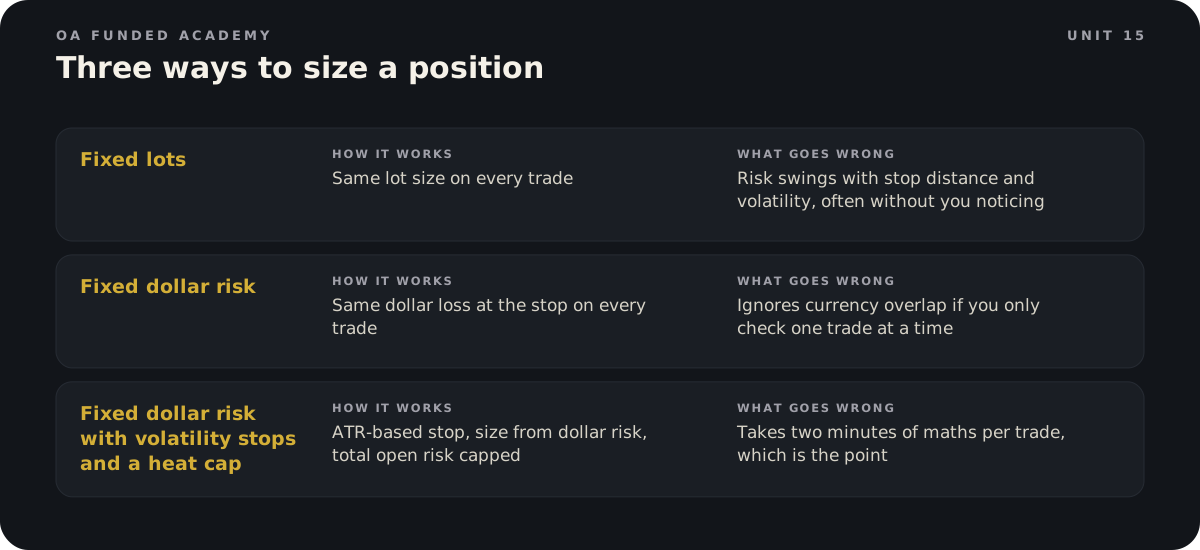
Volatility-adjusted sizing fixes this. You pick the dollar risk first. You place the stop where the chart says it belongs, often using a multiple of the Average True Range (ATR), which measures the average size of recent price bars. Then you work out the lot size that makes that stop cost exactly your dollar risk.
The formula is simple: lots = dollar risk / (stop in pips x pip value per lot). For EUR/USD, one standard lot is worth about $10 per pip. Wider stops give smaller positions. Tighter stops give larger ones. Your dollar risk stays the same either way.
Leverage does not change any of this. On OA Funded leverage is up to 1:50, depending on the instrument. Leverage decides how large a position you can open. Your stop and your lot size decide what you can lose. Treat available margin as a ceiling you should almost never approach.
Worked example
Same risk, different weeks
A $10,000 account risking 0.5% per trade, which is $50. You trade EUR/USD and place stops at 1.5 x the 14-period ATR on your chart. One standard lot is about $10 per pip.
- Quiet week: ATR is 40 pips, so the stop is 60 pips. Lots = $50 / (60 x $10) = 0.083. Round down to 0.08 lots, risking $48.
- Busy week: ATR is 60 pips, so the stop is 90 pips. Lots = $50 / (90 x $10) = 0.055. Round down to 0.05 lots, risking $45.
- The trader who kept 0.08 lots in the busy week risks 90 x $10 x 0.08 = $72, which is 44% more than planned.
- Five losers in a row at $72 is $360. At $45 to $48 it is $225 to $240.
- Always round lot sizes down, never up.
Takeaway: Fix the dollars, not the lots. Let the stop distance decide the size.
The drawdown maths nobody likes
Losses and gains are not symmetrical. Lose 10% and you need 11.1% to get back. Lose 20% and you need 25%. Lose 30% and you need 42.9%. Lose half and you need to double what is left. The formula is: gain needed = 1 / (1 - drawdown) - 1.
That asymmetry is why the urge to win it back fast is so dangerous. After a drawdown, the account is smaller, the job is bigger, and the temptation is to raise size. Raising size raises the chance of the next drawdown, which makes the job bigger again.
What experienced traders do instead feels backwards: they cut size during a drawdown and only return to normal after a set amount of the loss is recovered. Recovery is slower. The account survives.
On a prop account the maths has a second edge. A floor sits under you. Every dollar of drawdown is a dollar closer to it, and the target is measured from where you started, not from where you are now.
Worked example
A 6% hole on a $10,000 evaluation
A $10,000 OA Funded Phase 1 account. The Phase 1 target is 8%, so the closed balance needs to reach $10,800. After a bad run the balance is $9,400.
- Getting back to $10,000 needs $600, which is 6.4% of $9,400.
- Reaching the target needs $1,400, which is 14.9% of $9,400.
- The static floor is fixed at $9,000. Room to the floor is now $400.
- At the old risk of $100 a trade, four losers in a row would put equity at the floor. At $50 a trade, it takes eight.
- A sensible plan: drop to $50 a trade until the balance is back above $9,700, then return to normal size. There is no time limit on OA Funded evaluations, so the slower route costs patience, not a deadline.
Takeaway: In a drawdown, the first job is distance from the floor. The target can wait.
An account falls 20% from its high. Roughly what gain on the reduced balance does it need to return to the high?
Risk of ruin, without the formulas
Risk of ruin is the chance your account hits a level it cannot come back from. On a personal account that might be a loss that makes you quit. On a prop account it is simply the floor.
You do not need the formal equations to use the idea. Divide your room by your risk per trade. That is how many losers in a row you can take. On a $10,000 OA Funded account at the start, room to the static floor is $1,000. At 2% a trade, five straight losers reach it. At 1%, ten. At 0.5%, twenty.
Now the part traders underestimate. Losing streaks are normal. With a 50% win rate, the chance of at least one run of five losers somewhere in 100 trades is about 81%. A run of six is about 55%. A run of eight is about 17%. With a 40% win rate, the chance of a run of ten in 100 trades is about 20%. These are coin-flip maths, not predictions for your strategy, but they show why 'it will not happen to me' is the wrong plan.
So size for the streak you will eventually see, not the one you hope for. If your edge has never been through a long losing run in testing, assume it will.
A $25,000 OA Funded account is at its starting balance with no trades open. You risk $250 per trade. How many full losers in a row would take equity to the static floor?
Avoid these
Common mistakes.
Mistake
Counting trades instead of currency exposure
Do this instead
Write open exposure by currency before each new trade. Trades that share a currency share one risk budget.
Mistake
Calling long EUR/USD and short USD/CHF a hedge
Do this instead
Both are short the US dollar. Negatively correlated pairs traded in opposite directions double the bet.
Mistake
Keeping fixed lots as volatility changes
Do this instead
Fix the dollar risk, place the stop by volatility, and calculate lots from both.
Mistake
Never adding up total open risk
Do this instead
Track portfolio heat, including today's realised loss, and keep it under a written cap.
Mistake
Raising size to recover a drawdown faster
Do this instead
Cut size during a drawdown and return to normal only at a predefined recovery point.
Mistake
Treating stops as guaranteed fills
Do this instead
Leave a slippage buffer in your heat, especially around high-impact news.
Mistake
Sizing for the losing streak you expect
Do this instead
Size so you can survive at least ten losers in a row before a floor. Long streaks are common even with a real edge.
Keep the language straight
Quick glossary.
- Correlation
- A measure from +1 to -1 of how closely two instruments move together.
- Currency exposure
- Your net long or short position in each individual currency across all open trades.
- Portfolio heat
- The total loss if every open stop were hit now, plus any loss already taken today.
- Average True Range (ATR)
- An indicator showing the average size of recent price bars, used to judge volatility and set stop distance.
- Volatility-adjusted sizing
- Choosing lot size so that a volatility-based stop costs a fixed dollar amount.
- Drawdown
- The fall in account value from a previous high, in dollars or percent.
- Risk of ruin
- The probability of losses large enough to end the account or make it unviable.
- Slippage
- The difference between the price you expected and the price you were filled at.
Lesson check.
6 questions on the whole unit. Score 80% or more to show you have it.
1.A $25,000 account risks 0.4% per trade. On EUR/USD you place the stop at 1.5 x ATR, and ATR is 50 pips. One standard lot is about $10 per pip. What position size fits?
2.An account falls 15% from its high. Roughly what gain on the reduced balance does it need to get back to the high?
3.On a $25,000 account your heat cap is 1.5%. Your three open trades risk $100, $75 and $125 to their stops, and you have already lost $150 today. Can you add a $100 trade?
4.A trader is long EUR/USD and short USD/CHF and calls it a hedge. What is actually going on?
5.Why does this unit say to plan your heat cap for a shock day rather than an average day?
6.Your account is in a 6% drawdown. Which response matches what experienced traders do?
Practice room
3 activitiesTurn the idea into a decision.
These are fictional learning scenarios. They never place trades or use real money. Complete the required checks to finish this lesson.
Finish this unit
Pass each required activity, then save the current lesson version to your record.
Public lesson Q&A
Ask what is still unclear.
No published questions yet.
Sources and review
- BabyPips: Always Know Your Risk ExposureReviewed 2026-10-31Open (opens in a new tab)
- BabyPips: What Is Currency CorrelationReviewed 2026-10-31Open (opens in a new tab)
- TradeZella: Drawdown Recovery CalculatorReviewed 2026-10-31Open (opens in a new tab)
- Wikipedia: Risk of ruinReviewed 2026-10-31Open (opens in a new tab)
- TradeZero: The ATR Position Sizing FormulaReviewed 2026-10-31Open (opens in a new tab)
- OA Funded RulesReviewed 2026-10-31Open (opens in a new tab)