

Unit 03 · 40 min read
Charts, Platforms, Orders and Execution.
Read candlestick charts and timeframes, choose the order type that matches what you actually want, understand why stops can fill worse than planned, and use a short ticket check that catches costly typing mistakes.
- Level
- Beginner
- Revision
- mentor-2026-10
- Access
- Public
By the end, you can
- Read open, high, low and close from a candle and explain what it hides
- Choose a sensible timeframe and give each timeframe a clear job
- Match market, limit and stop orders to the intent behind them
- Explain slippage and estimate its dollar impact on a planned loss
- Run a pre-submit ticket check on every order
What a chart really shows
You now know what a currency pair is and how a long or short makes or loses money. The next step is the screen you will stare at every day: the chart.
A price chart is a record of where trades happened over time. Time runs left to right along the bottom. Price runs up the right-hand side. That is all it is. It is a history, not a forecast. Anything you draw on it is your interpretation of that history.
Most platforms build their charts from the bid price, the price at which you can sell. When you buy, you pay the slightly higher ask. So a buy order can fill a little above the line you see on the chart, and a sell stop can be triggered by the bid. Keep that in mind when a trade seems to have filled at a price the chart never showed. Often the spread is the explanation.
Candles: four prices in one shape
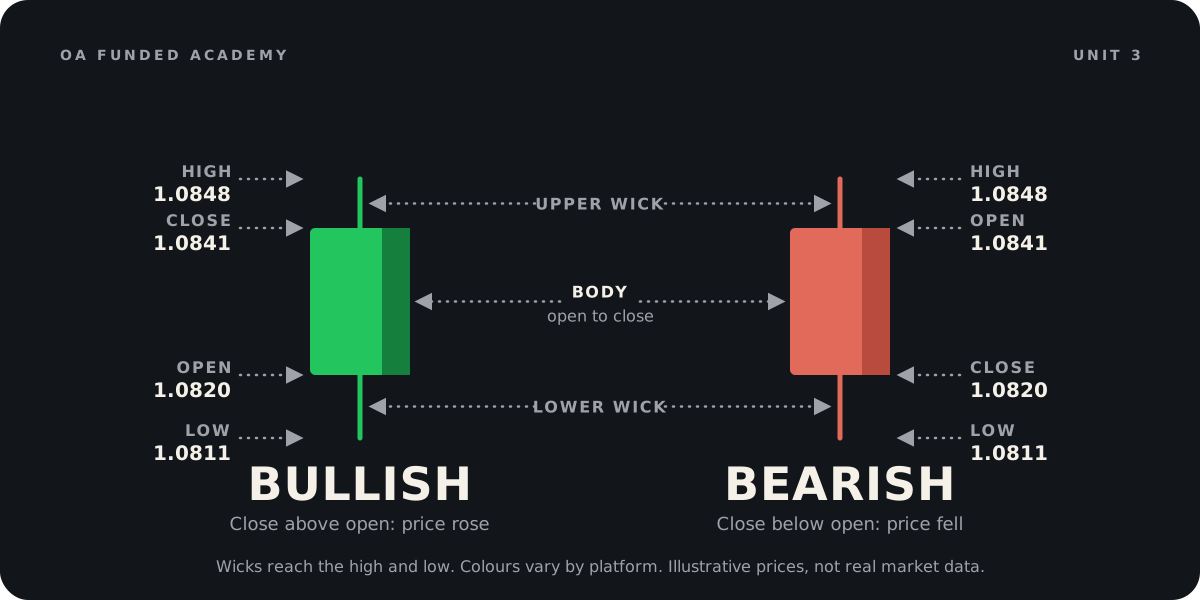
The most common chart style is the candlestick chart. Each candle summarises one slice of time, such as one hour. It shows four prices: the open (the first price in that slice), the high (the highest), the low (the lowest) and the close (the last).
The thick part is the body. It runs from the open to the close. The thin lines above and below are the wicks, sometimes called shadows. They reach up to the high and down to the low. If the close is above the open, the price rose during that slice and the candle is usually drawn green or white. If the close is below the open, it fell and the candle is usually red or black. Colours vary by platform, so check your settings.
Here is what a candle does not tell you: the order in which things happened. A green hourly candle might have dropped first and then rallied, or rallied, dropped and rallied again. If you were in a trade during that hour, the path mattered a great deal. The candle only shows the summary.
Worked example
Read one candle, then feel what it hides
A one-hour EUR/USD candle shows: open 1.0820, high 1.0848, low 1.0811, close 1.0841. You are practising on a $10,000 account with positions of 10,000 units.
- The close (1.0841) is above the open (1.0820), so the price rose this hour. This is a green candle. The body is 1.0841 minus 1.0820 = 0.0021.
- The full range, high minus low, is 1.0848 minus 1.0811 = 0.0037. On 10,000 units, every 0.0001 is worth $1, so the range is worth $37.
- A buyer who entered at the open, 1.0820, and held to the close made 10,000 x 0.0021 = $21 before costs.
- But the low was 1.0811. At that moment the same buyer was down 10,000 x 0.0009 = $9. If their stop had been at 1.0815, they would have been stopped out for a $5 loss and missed the rise entirely.
- The candle looks like a calm, steady hour. For someone with a tight stop, it was not.
Takeaway: A candle is a summary. Before you trust a stop distance, look at the wicks: they show how far price has recently swung against positions inside a single bar.
A candle opens at 1.2700, reaches 1.2735, drops to 1.2660 and closes at 1.2690. Which statement is true?
The platform and the order ticket
Your platform is the software where you see charts and send orders. On OA Funded the platform is TradeLocker. Every platform looks a little different, but every order ticket asks the same questions, and you should be able to answer each one before you open it.
Account: which account will this order go to? Many traders have a practice account and another account open at the same time. Symbol: which pair? Side: buy or sell? Size: how many units? Many platforms show size in lots. One standard lot is 100,000 units of the base currency, 0.10 lots is 10,000 units and 0.01 lots is 1,000 units. Order type: market, limit or stop (explained next). Stop-loss: the price at which the trade closes automatically if you are wrong. Take-profit: the price at which it closes automatically if it reaches your target.
A good habit: decide every one of those answers on paper or in your journal first. The ticket is where you copy your decisions in, not where you make them.
Limits wait for a better price; stops wait for confirmation
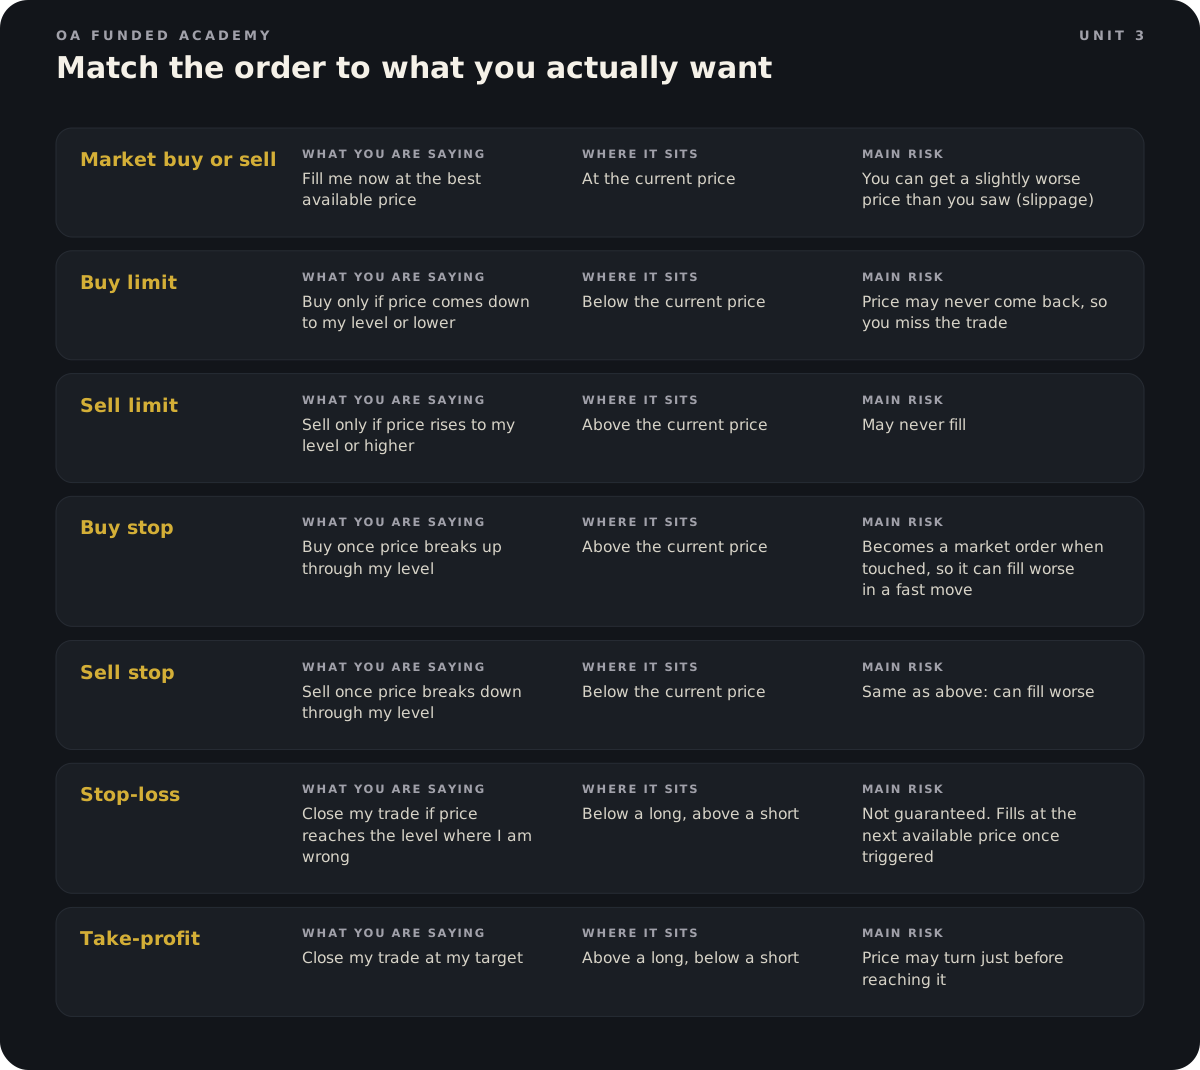
Here is a simple way to remember the difference. A limit order says 'only at this price or better'. You use it when you want to buy cheaper or sell higher than the market is now. A stop order says 'once price gets here, get me in or out'. You use it when you want the market to prove something first, such as breaking above a level, or when you want out because your idea has failed.
A stop-loss is a stop order that closes a trade. When the price touches your stop level, the platform sends an order to close at the next available price. Most of the time that price is at or very close to your level. But in a fast market, after big news or when the market reopens after a weekend, the next available price can be well beyond your stop. Traders on forums regularly post screenshots asking whether their stop 'failed'. Usually it worked exactly as designed. The price simply jumped past it.
Some providers offer guaranteed stops for an extra charge. Most accounts do not have them. Assume yours does not unless the provider says so in writing.
EUR/USD is at 1.0850. You want to buy only if it dips to 1.0820. Which order do you use?
Worked example
From plan to ticket on a $10,000 account
Your plan: buy EUR/USD at 1.0850. Your idea is wrong if price falls to 1.0825, so that is your stop. Your target is 1.0900. You have decided to risk no more than $50 on this trade, which is 0.5% of your $10,000 account.
- Stop distance: 1.0850 minus 1.0825 = 0.0025.
- Size so the loss at the stop is $50: $50 divided by 0.0025 = 20,000 units, which is 0.20 lots. Check: 20,000 x 0.0025 = $50.
- Add the spread. If it is 0.0001, that costs 20,000 x 0.0001 = $2. Realistic loss if stopped: about $52.
- Potential gain at the target: 1.0900 minus 1.0850 = 0.0050. 20,000 x 0.0050 = $100 before costs, about $98 after the spread.
- Ticket: account = practice, symbol = EUR/USD, side = buy, size = 0.20 lots, order type = market (or a buy limit if you want exactly 1.0850 or better), stop-loss = 1.0825 (below the entry), take-profit = 1.0900 (above the entry).
Takeaway: The stop comes from where your idea is wrong. The size comes from the stop and your dollar limit. The ticket just records those decisions.
Worked example
When the stop fills worse: slippage on a $25,000 account
You sell 30,000 GBP/USD at 1.2700 on a $25,000 account, with a stop-loss at 1.2730. Planned risk: 30,000 x 0.0030 = $90, which is 0.36% of the account. A surprise headline hits and price jumps.
- Price leaps from 1.2725 to 1.2745 in a single move. Your stop at 1.2730 is touched on the way, and the platform sends the order to close.
- The next available price is 1.2742. Your trade closes there.
- Actual loss: 1.2742 minus 1.2700 = 0.0042. 30,000 x 0.0042 = $126.
- Slippage: $126 minus $90 = $36 more than planned. Your 0.36% risk became about 0.50% of the account.
- If you had been risking 2% per trade instead ($500 planned), the same 40% overshoot would have cost about $700, or 2.8% of the account, on one trade.
Takeaway: Plan as if your stop could fill worse than its price. Smaller size is the only protection that works every time.
The ten-second ticket check
Many of the most painful losses beginners describe come from typing, not from analysis. One common example: you mean to type 0.20 lots and type 2.0. On the trade above, the loss at the stop becomes 200,000 x 0.0025 = $500 instead of $50. That is 5% of a $10,000 account, gone because of one decimal point. Other classics: pressing sell when you meant buy, sending the order to the wrong account, or trading GBP/USD when your plan was for EUR/GBP.
The fix is boring and it works. Before every order, stop for ten seconds and read the ticket out loud, in this order. Account. Symbol. Side. Size, and what that size loses in dollars at the stop. Order type. Stop-loss on the correct side: below a long, above a short. Take-profit on the correct side. Then send.
After the order fills, check the open position immediately. Is the size what you meant? Is the stop really attached? If anything is wrong, close or fix it straight away, before the market decides for you.
You sell USD/JPY at 150.00. Where should your stop-loss sit?
Avoid these
Common mistakes.
Mistake
Treating a green candle as a buy signal and a red candle as a sell signal
Do this instead
Read the open, high, low and close and the bigger picture. One candle's colour says very little on its own.
Mistake
Switching timeframes until one agrees with the trade you want
Do this instead
Give each timeframe one job before you look, and stick to it.
Mistake
Using a buy stop when you meant to buy a dip
Do this instead
Limit means 'at this price or better'. Stop means 'once price gets here'. Say which one you mean before choosing.
Mistake
Assuming the stop-loss caps the loss at exactly the stop distance
Do this instead
Expect slippage in fast markets. Keep size small enough that a worse fill is still acceptable.
Mistake
Typing size in a hurry and adding a zero
Do this instead
Read the size out loud and say its dollar loss at the stop before sending.
Mistake
Putting the stop on the wrong side of the entry
Do this instead
Below a long, above a short, every time. Check it on the open position after the fill.
Mistake
Moving the stop further away because the trade feels uncomfortable
Do this instead
Set the stop where the idea is wrong before entry. If you want a wider stop, reduce size or skip the trade.
Keep the language straight
Quick glossary.
- Candlestick
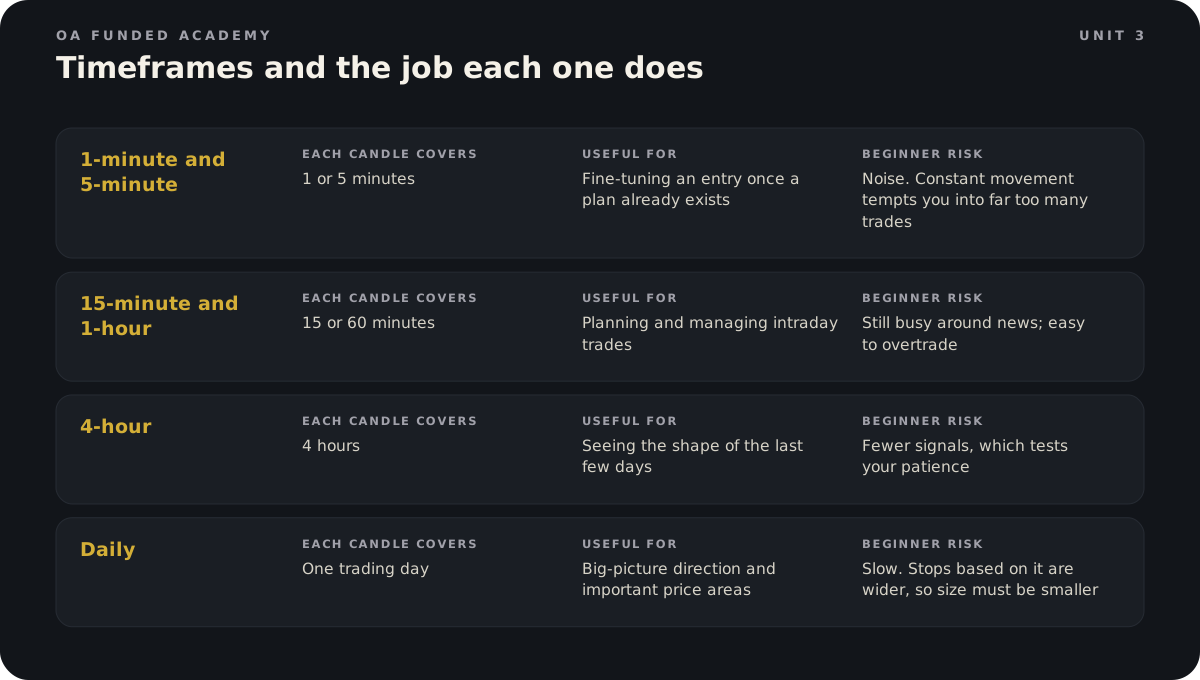
- A chart bar showing the open, high, low and close for one slice of time.
- Wick
- The thin line above or below a candle body showing the high or low.
- Timeframe
- The length of time each candle on a chart covers, such as 1 hour.
- Lot
- A size unit: one standard lot is 100,000 units of the base currency, 0.10 lots is 10,000 units.
- Market order
- An instruction to fill immediately at the best available price.
- Limit order
- An instruction to fill only at a stated price or better.
- Stop order
- An instruction that becomes a market order once price reaches a trigger level.
- Stop-loss
- A stop order that closes a trade when price reaches the level where your idea is wrong.
- Take-profit
- An order that closes a trade at your target price.
- Slippage
- The difference between the price you expected and the price you actually got.
Lesson check.
6 questions on the whole unit. Score 80% or more to show you have it.
1.A one-hour EUR/USD candle shows open 1.0900, high 1.0912, low 1.0868, close 1.0905. A trader bought 10,000 units at the open with a stop at 1.0875. What most likely happened?
2.GBP/USD is at 1.2700. You want to buy only if price breaks up through 1.2740. Which order matches that intent?
3.You have a $10,000 account and will risk $60. You plan to sell EUR/USD at 1.0880 with a stop at 1.0910. What size should you enter?
4.On a $25,000 account you buy 40,000 AUD/USD at 0.6600 with a stop at 0.6575. News hits and the stop fills at 0.6568. What did the trade lose?
5.You planned 0.20 lots on EUR/USD with a 30-pip stop (0.0030) but typed 2.0 lots. If the stop is hit, how does the loss compare with your plan?
6.Your 1-hour chart does not support the trade you want, so you check the 15-minute, then the 5-minute, until one agrees. What is the problem?
Practice room
3 activitiesTurn the idea into a decision.
These are fictional learning scenarios. They never place trades or use real money. Complete the required checks to finish this lesson.
Finish this unit
Pass each required activity, then save the current lesson version to your record.
Public lesson Q&A
Ask what is still unclear.
No published questions yet.
Sources and review
- NFA: Trading Forex, what investors need to knowReviewed 2026-10-31Open (opens in a new tab)
- Investor.gov (SEC): Forex Trading for Individual InvestorsReviewed 2026-10-31Open (opens in a new tab)
- Babypips forum: Did the stop loss fail?Reviewed 2026-10-31Open (opens in a new tab)
- Babypips forum: 53 pip slippage on a stop lossReviewed 2026-10-31Open (opens in a new tab)
- FxPro help centre: What is slippage?Reviewed 2026-10-31Open (opens in a new tab)