

Unit 09 · 40 min read
Developing and Testing an Edge.
Turn a trading idea into a falsifiable hypothesis with fixed rules, then test it honestly on past and unseen data, with costs and losing streaks included, before you trust it with an account.
- Level
- Intermediate
- Revision
- mentor-2026-10
- Access
- Public
By the end, you can
- Write a falsifiable trading hypothesis
- Run a backtest that logs every valid signal with fixed rules
- Calculate expectancy in R and dollars, including costs
- Estimate the losing streaks and drawdown a strategy is likely to produce
- Separate in-sample, out-of-sample and forward testing
- Set accept, revise and reject criteria before looking at results
What an edge is, and what it is not
An edge is a set of rules that, applied the same way many times, has produced a positive average result after costs under defined conditions. That is all. It is not a feeling that you can read the market. It is not a setup that worked last Tuesday. And it is never a guarantee about the next trade, or the next fifty.
Most newer traders skip this stage. They watch a video, try a setup for a week, lose four in a row and move on to the next one. A year later they have tried twelve strategies and know nothing about any of them. Each one was abandoned during a losing streak that was completely normal for it.
Testing breaks that cycle. When you know what your setup has done over a hundred past trades, a losing streak of five stops being a crisis. You can look at your numbers and say, "This is inside the range I expected." That calm is worth more than any indicator.
Testing also tells you when to walk away. Some ideas will fail the test, and that is a good outcome. You found out on a spreadsheet instead of with an account. A rejected hypothesis is progress, because it narrows down what is worth your time.
Start with a hypothesis, not a screenshot
Write down the idea before you scroll through charts. If you look first, your brain finds the examples that worked and quietly skips the ones that did not. Everyone does this. It is called confirmation bias, and backtests are full of it.
A useful hypothesis has four parts. The condition (what the market is doing). The behaviour you expect (what price tends to do next). The reason you think it happens. And the evidence that would prove you wrong.
The last part matters most. If no result could make you drop the idea, it is not a hypothesis. It is a belief.
Worked example
From idea to testable hypothesis
A trader thinks "pullbacks in a trend work well on GBP/USD". Here is how that becomes something you can test.
- Condition: the 4-hour chart has a higher high and a higher low, and price is above the 50-period moving average.
- Expected behaviour: when price pulls back to the last 4-hour higher low during the London session, it resumes upward at least 1.5 times the stop distance more often than it hits the stop.
- Reason: in a trend, participants who missed the move tend to buy pullbacks to recent structure.
- Rules: trigger is a 15-minute close above the previous candle's high inside the zone; stop 3 pips below the pullback low; target 1.8R; exit at 16:00 London time if neither is hit.
- Rejection test: if expectancy after costs over at least 80 trades is below +0.05R, or the out-of-sample result is negative, the idea is rejected in its current form.
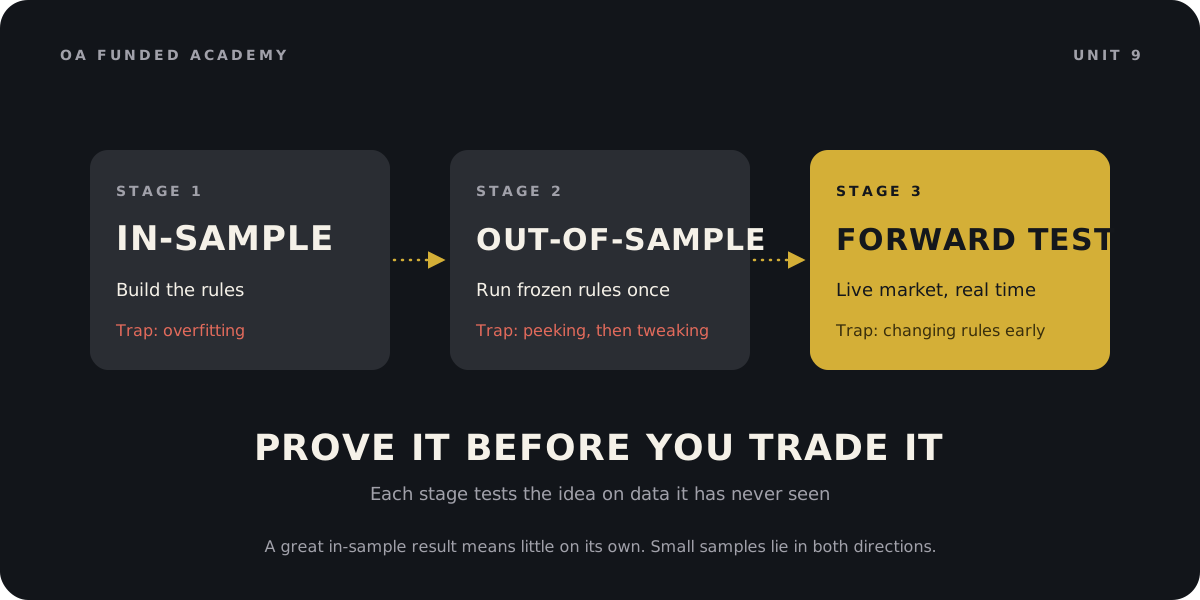
- Data: 2022 and 2023 for building and checking rules (in-sample). 2024 kept untouched (out-of-sample).
Takeaway: Every part can be checked on a chart. The rejection test is written before a single trade is logged, so the results cannot talk you out of it.
Running an honest backtest
Freeze the rules first. Then go through the data bar by bar, from left to right, and log every signal the rules produce. Every one. Not just the clean-looking ones.
Hide the right side of the chart. Most charting platforms have a replay mode. Use it. If you can see what happened next, you will judge setups differently, even if you do not mean to. This is called look-ahead bias.
Log the boring details: date, time, entry, stop, target, result in R, and whether a news release was nearby. Note the spread at the time if you can.
Count costs. Every round trip pays the spread, and some accounts pay commission. Live fills are often a little worse than the chart price, especially around news. A simple habit is to subtract a fixed cost from every trade, such as 0.1R, and see whether the edge survives.
Test in different conditions. A trend-following setup that only saw trending months will look great until the market goes sideways. Include quiet periods, volatile periods and ranges.
Worked example
Measuring expectancy with real numbers
The GBP/USD hypothesis produces 80 in-sample trades. The trader uses a $10,000 account at 0.5% risk, so 1R = $50.
- Results: 34 winners (42.5%) averaging +1.8R, and 46 losers (57.5%) averaging -1.0R.
- Gross expectancy: (0.425 x 1.8) - (0.575 x 1.0) = 0.765 - 0.575 = +0.19R per trade.
- Costs: spread and slippage are estimated at 0.1R per trade. Net expectancy: 0.19 - 0.10 = +0.09R.
- In dollars: 0.09 x $50 = about $4.50 per trade on average, before any variation.
- Over 80 trades that is roughly +7.2R, or about $360, as a historical average, not a forecast.
- Notice how much of the edge the costs ate: more than half. If costs were really 0.15R instead of 0.1R, net expectancy would drop to +0.04R and fall below the rejection threshold of +0.05R.
Takeaway: Win rate alone tells you almost nothing. A 42.5% win rate can be positive with a 1.8R average winner. Costs often decide whether a small edge exists at all.
Illustrative only. Real results vary from trade to trade and a sample this small proves nothing on its own.
A setup wins 60% of the time with an average win of 0.5R and an average loss of 1.0R. What is its expectancy before costs?
Worked example
How long the losing streaks will be
The same setup loses 57.5% of trades. The trader now runs it on a $25,000 account at 0.5% risk, so 1R = $125. How bad can a normal run get?
- The chance of any specific five trades all losing is 0.575 to the power of 5, about 6.3%.
- Over 100 trades there are many chances for a streak. A common rule of thumb is that the longest losing streak to expect is about log(number of trades) divided by log(1 / loss rate): ln(100) / ln(1 / 0.575) = 4.61 / 0.553, or about 8.
- Eight losses in a row at $125 is -$1,000, or 4% of the account, from a setup that is positive on average.
- Peak-to-trough drawdown can be larger than the longest streak, because losing runs can be broken by a single small winner and then continue.
- A trader who does not know this will probably quit somewhere around loss five, which is exactly what this setup is expected to do sometimes.
Takeaway: Before you trade a setup, know the streak it is likely to throw at you, and size so that streak is survivable inside your limits.
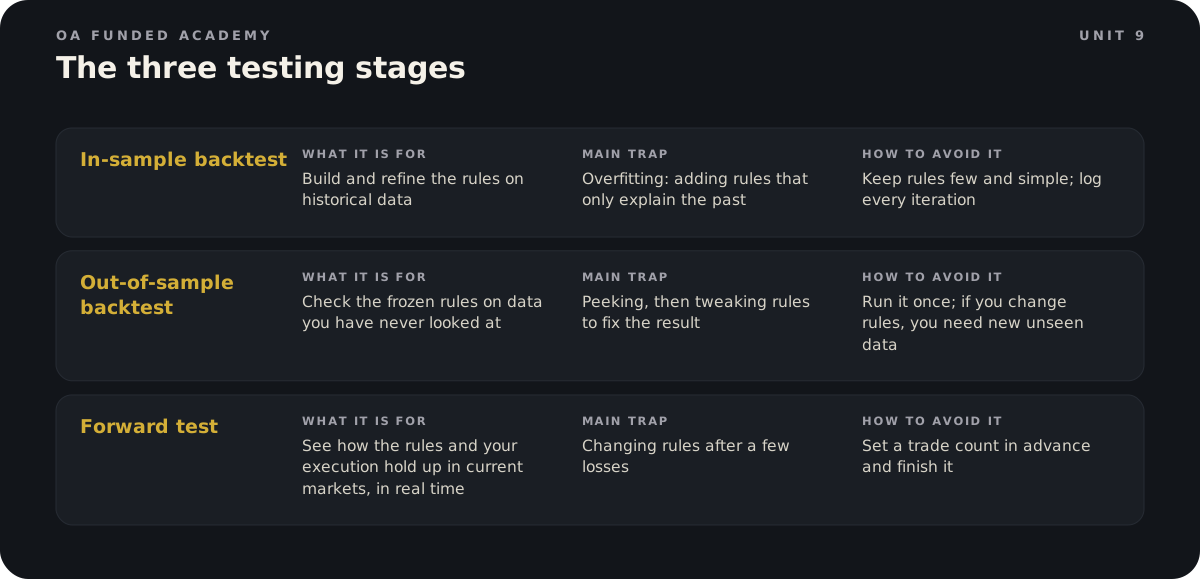
Out-of-sample: the test that keeps you honest
Once the in-sample work is done, freeze the rules. Write them down with the date. Then run them, once, on the data you kept aside. Many educators suggest holding back about 30% of your data for this. Treat that as a rule of thumb, not a law.
A real edge usually gets a bit weaker on unseen data. That is normal. An overfit one often collapses. If your in-sample expectancy was +0.09R and the out-of-sample comes in at +0.05R, that is encouraging. If it comes in at -0.2R, the in-sample result was probably noise.
Here is the hard part. If the out-of-sample result disappoints and you go back to tweak the rules, that data is no longer unseen. You have used it to build the strategy. You would need fresh data to test again. Log every iteration so you know how many ideas you tried on the same history. The more you try, the more likely one looks good by chance.
Your out-of-sample test comes back slightly negative. You adjust the stop rule and rerun it on the same out-of-sample data, and now it is positive. What have you shown?
Forward testing: where you meet yourself
A backtest tells you what the rules did. A forward test tells you what you do with the rules, in real time, with real spreads and real nerves. Many strategies that test well historically disappoint live because of execution, slippage and psychology.
Run the forward test on a demo or in a simulated environment first. Set the trade count before you start, for example 40 trades, and do not change rules until you reach it. Track two numbers separately: the result of trades taken exactly by the rules, and how often you followed the rules at all.
Compare the forward results with the backtest. If you are following the rules and the numbers sit within the backtest's normal range, the idea is holding up so far. If the numbers are far worse, check execution first: late entries, skipped trades, moved stops. Only then question the setup.
Fit the test to the account you plan to trade. On OA Funded, for example, every trade must stay open for at least 2 minutes, so a scalping idea that typically holds trades for 60 seconds does not fit that account, however well it tests.
Before testing, you wrote: reject if net expectancy is below +0.05R over 80+ trades. Your result is +0.03R over 90 trades, but the last 20 trades were strong. What do you do?
Avoid these
Common mistakes.
Mistake
Testing by scrolling for examples that worked
Do this instead
Write the hypothesis first, use replay mode and log every valid signal in the date range.
Mistake
Judging a strategy on win rate alone
Do this instead
Calculate expectancy using average win and average loss, then subtract costs.
Mistake
Leaving out spreads and slippage
Do this instead
Apply a fixed cost to every trade and check whether the edge survives a higher estimate.
Mistake
Adding filters until the backtest looks perfect
Do this instead
Keep a handful of rules with a market reason and confirm them on unseen data.
Mistake
Reusing out-of-sample data after changing rules
Do this instead
Once used to change rules, data becomes in-sample. Use fresh data for the next check.
Mistake
Quitting a setup during a normal losing streak
Do this instead
Estimate the likely longest streak before trading it and size so that streak is survivable.
Mistake
Moving the accept or reject threshold after seeing results
Do this instead
Write the threshold first and treat it as final for that test.
Keep the language straight
Quick glossary.
- Edge
- A set of rules that has produced a positive average result after costs over many trades under defined conditions.
- Hypothesis
- A testable statement of a market condition, the expected behaviour and what would prove it wrong.
- Backtest
- Applying fixed rules to historical data to see how they would have performed.
- Expectancy
- The average result per trade over many trades, usually in R: (win rate x average win) minus (loss rate x average loss).
- Out-of-sample data
- Historical data not used to build the rules, kept aside for an honest check.
- Curve fitting
- Adding rules that fit past noise, so results look strong historically but tend to fail on new data.
- Look-ahead bias
- Using information that would not have been available at the time of the trade.
- Drawdown
- The decline from a peak in account value to a later low.
- Forward test
- Trading the frozen rules in real time, usually on demo or simulation, to check execution and current fit.
Lesson check.
6 questions on the whole unit. Score 80% or more to show you have it.
1.A backtest of 100 trades shows 38% winners averaging +2.2R and 62% losers averaging -1.0R. You estimate costs at 0.12R per trade, and 1R is $80. What is the net expectancy?
2.A setup loses 60% of its trades. Using the rule of thumb ln(number of trades) / ln(1 / loss rate), about how long a losing streak should you expect over 200 trades, and what would it cost at $100 per R?
3.Which of these is a testable trading hypothesis?
4.A backtest report shows 9 filters, 40 trades, a 78% win rate and no out-of-sample test. What is the most likely explanation?
5.Why should you use replay mode, or hide the right side of the chart, when running a backtest?
6.Your 40-trade forward test on demo comes in well below the backtest. You followed the rules on only 28 of the 40 trades. What should you check first?
Practice room
3 activitiesTurn the idea into a decision.
These are fictional learning scenarios. They never place trades or use real money. Complete the required checks to finish this lesson.
Finish this unit
Pass each required activity, then save the current lesson version to your record.
Public lesson Q&A
Ask what is still unclear.
No published questions yet.
Sources and review
- FX Replay: Common Pitfalls in Forex Backtesting (and How to Avoid Them)Reviewed 2026-10-31Open (opens in a new tab)
- ABC Trading Group: 8 Backtesting Pitfalls That Ruin Your Trading StrategiesReviewed 2026-10-31Open (opens in a new tab)
- TradingView Education: Backtesting and overfitting ideasReviewed 2026-10-31Open (opens in a new tab)
- TurtleTrader: Brett Steenbarger's Three Vices of Trading (perfectionism and losing streaks)Reviewed 2026-10-31Open (opens in a new tab)