

Unit 06 · 52 min read
Forex Analysis Foundations.
Learn to read what a chart is doing right now: trending, ranging or changing. Mark support and resistance as zones, recognise failed breakouts, give each timeframe one job, and check the news calendar. The goal is a written if/then plan with a stop and a pass option, not a prediction.
- Level
- Beginner
- Revision
- mentor-2026-10
- Access
- Public
By the end, you can
- Classify a chart as trending up, trending down, ranging or in transition, using swing highs and lows
- Mark support and resistance as zones and explain why zones work better than lines
- Describe a failed breakout and plan a response to one
- Assign each of three timeframes a single job
- Check an economic calendar and decide when not to have a position open
- Write a conditional trade plan with context, trigger, stop, target and a pass condition
What analysis can and cannot do
Let me be straight with you before we start. No amount of chart reading tells you what price will do next. Not mine, not anyone's. If someone tells you their method predicts the market, they are either mistaken or selling something.
What analysis can do is organise your thinking. It tells you what kind of market you are in, where the obvious decision areas are, and what would prove your idea wrong. That last part is the most valuable. A good plan is not one that is always right. It is one where you know in advance where you are wrong and how much that costs, which you learned to size in Unit 5.
So in this unit, every piece of analysis ends in the same shape: if this happens, I will do that, my stop goes here, and if the condition never shows up, I do nothing. Doing nothing is a valid result. Most of the time it is the right one.
Structure: swing highs and swing lows
Market structure is the pattern of peaks and dips on a chart. A swing high is a peak with lower prices on both sides of it. A swing low is a dip with higher prices on both sides. Mark these on a clean chart before you add anything else.
An uptrend is a series of higher highs and higher lows. Each peak is above the last peak, and each dip stays above the last dip. A downtrend is the mirror: lower highs and lower lows. A range is when price keeps turning around between roughly the same high area and the same low area, with no clear progress either way.
Transition is the messy middle. An uptrend makes a lower low for the first time, or a range breaks one side and then stalls. You will spend a lot of time in transition. It is fine to label a chart "unclear" and move on. Forcing a label onto a messy chart is how bad trades start.
Worked example
Reading swings on a daily EUR/USD chart
Over six weeks, the daily EUR/USD chart makes these swing points in order: low 1.0700, high 1.0820, low 1.0750, high 1.0890, low 1.0810.
- Compare the highs: 1.0820 then 1.0890. The second is higher. That is a higher high.
- Compare the lows: 1.0700, then 1.0750, then 1.0810. Each is higher than the one before. Those are higher lows.
- Label: uptrend on the daily chart.
- What would change the label? A daily close below 1.0810, the most recent higher low. That would be the first lower low and would move the chart into transition.
- Write it down: "Daily: uptrend. Structure breaks below 1.0810." You now have context and a line in the sand, and you have not predicted anything.
Takeaway: Label the regime from the swings, and write down the price that would change your label.
Support and resistance are zones, not lines
Support is an area below the current price where buying has stepped in before and pushed price up. Resistance is an area above where selling has stepped in before and pushed price down. They exist because many traders watch the same obvious levels and place orders around them.
The beginner mistake is to draw a single thin line and expect price to turn exactly there. Real markets do not work like that. Price often pushes a few pips past a level and comes back, because stops sitting just beyond the level get triggered. Draw support and resistance as zones, usually 10 to 30 pips tall on a daily EUR/USD chart, covering the area where price turned rather than one exact number.
A zone is stronger when price has reacted there several times, when the reactions were sharp, and when the zone lines up with a round number. It is weaker each time price returns and the reaction is smaller. And once a zone breaks properly, it often swaps roles: old resistance can act as support on the way back down. That swap is called role reversal. None of this is guaranteed. A zone is a place to watch for evidence, nothing more.
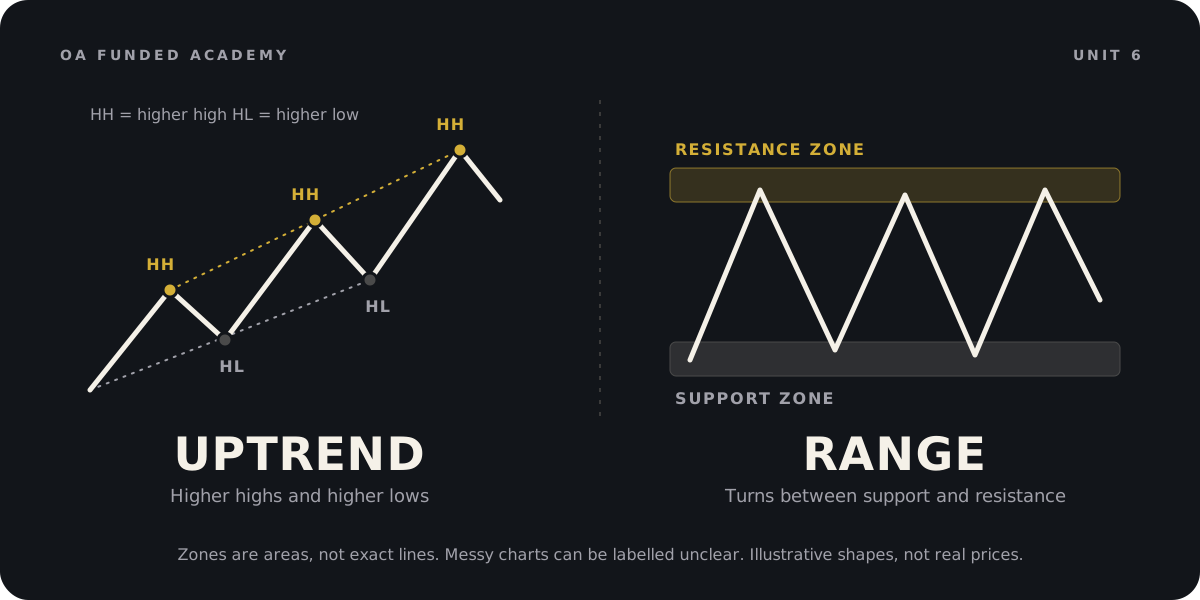
Price has bounced three times from the 1.0780 to 1.0800 area on EUR/USD. What is the most accurate way to treat that area next time price arrives?
Breakouts and failed breakouts
A breakout is when price moves through a support or resistance zone. Some breakouts keep going and turn into new trends. Many do not. A failed breakout, sometimes called a false breakout or fakeout, is when price pushes through a zone, triggers the breakout buyers or sellers, then reverses back inside.
Failed breakouts hurt beginners because they buy exactly at the moment the move is most exciting, and that is often when the move is about to run out. The traders who sold to them, or whose stops were just beyond the zone and have now been filled, are on the other side.
You do not need to predict which breakouts will fail. You need a rule. One common rule is to wait for a candle to close beyond the zone on your chosen timeframe before treating it as a break, instead of reacting to the first poke through. Another is to watch for a close back inside the zone after a break, which is the failed-breakout signal. Pick one rule, write it down, and stick to it long enough to see how it behaves.
Worked example
Planning a failed-breakout trade ($10K account)
EUR/USD has ranged for three weeks between support at 1.0780 to 1.0800 and resistance at 1.0920 to 1.0940. Today it spikes up to 1.0955, then the daily candle closes back inside at 1.0925. You have $10,000 and risk 0.5% per trade.
- Context: range. The push to 1.0955 failed and closed back inside the resistance zone. That is a failed breakout by your written rule.
- Plan: sell at 1.0925. Stop goes above the spike high with a small buffer, at 1.0965. Stop distance is 40 pips.
- Size: dollar risk $10,000 × 0.005 = $50. Loss per lot = 40 × $10 = $400. Size = $50 ÷ $400 = 0.125, rounded down to 0.12 lots. Risk at the stop = 40 × $1.20 = $48.
- Target: the middle of the range, about 1.0860. That is 65 pips. Gross if reached: 65 × $1.20 = $78, which is about 1.6R.
- Pass condition: if price is already back below 1.0900 when you check the chart, you missed it. Do not chase. The stop would be too far for the reward that is left.
Takeaway: A failed breakout gives you a clear invalidation point: just beyond the spike. That clarity is what makes it plannable, not any certainty it will work.
Multiple timeframes: one job each
A timeframe is how much time each candle on your chart represents. A daily chart shows one candle per day. A 4-hour chart shows six candles per day. A 1-hour chart shows twenty-four.
Multi-timeframe analysis means looking at the same pair on more than one timeframe so you see both the big picture and the detail. The trap is using extra timeframes to hunt for agreement. If the 1-hour says buy and you do not like that, you check the 15-minute, then the 5-minute, until something says what you wanted to hear. That is not analysis. That is shopping for permission.
The fix is to give each timeframe one fixed job before you look. A common beginner set is three charts, each about four to six times the one below. The higher chart (daily) gives the context: trend, range or unclear, and the major zones. The middle chart (4-hour) gives the area: where you would consider acting. The lower chart (1-hour) gives the trigger: the specific candle pattern or break that tells you to enter. If the higher chart says unclear, you stop there for that pair.
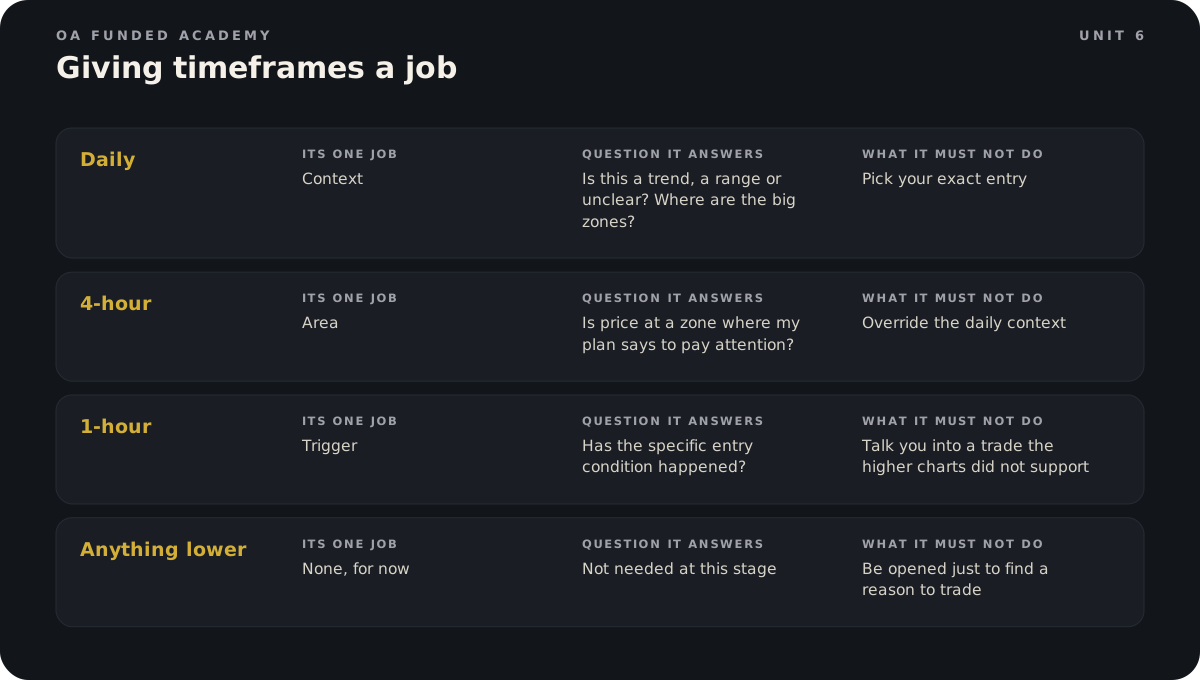
Worked example
A three-timeframe plan ($25K account)
You have $25,000 and risk 0.4% per trade. Daily EUR/USD is in the uptrend from the earlier example, with the last higher low at 1.0810. On the 4-hour chart, price is pulling back toward an old resistance zone at 1.0810 to 1.0830 that it broke above last week. Daily ATR, the average daily range over the last 14 days, is about 70 pips.
- Daily (context): uptrend. Plan only long trades while it holds above 1.0810.
- 4-hour (area): 1.0810 to 1.0830 is old resistance that may now act as support. That is where you pay attention.
- 1-hour (trigger): you will buy only if a 1-hour candle closes back above 1.0835 after dipping into the zone. Entry 1.0835.
- Stop: below the zone and below the daily higher low, at 1.0790. Stop distance is 45 pips, about two thirds of one day's average range. That is enough room for normal noise.
- Size: dollar risk $25,000 × 0.004 = $100. Loss per lot = 45 × $10 = $450. Size = $100 ÷ $450 = 0.222, rounded down to 0.22 lots. Risk at the stop = 45 × $2.20 = $99.
- Target: the recent high at 1.0890, which is 55 pips, or about 1.2R gross ($121). Pass if the trigger has not happened by the end of the day, or if a high-impact release is due before you could reasonably manage the trade.
Takeaway: Daily says which direction is allowed, 4-hour says where, 1-hour says when. And you write the pass condition before you start.
News awareness: know what is on the calendar
An economic calendar lists scheduled releases and events by date, time, currency and expected impact. The big ones for most pairs are central bank interest rate decisions, inflation reports such as CPI, employment reports such as US Non-Farm Payrolls, and GDP figures. Check the calendar at the start of every session. It takes two minutes.
Around high-impact releases, three things tend to happen. Spreads widen, sometimes to several times normal. Price can jump through levels without trading at the prices in between, so stops can fill well beyond where you set them. And the first move after a release often reverses within minutes. None of these tell you the direction. A strong number can still send a currency down if the market expected even stronger.
For a beginner, the simplest rule is to be flat, meaning no open position, for a short window around high-impact releases on the currencies you trade, and to avoid entering just before them. On OA Funded, news trading is unrestricted during the evaluation, but on a funded account you may not create or increase exposure from two minutes before to two minutes after a designated high-impact event. Your own window can be wider than that if you prefer.
News events: reading the economic calendar
Every trading day has a schedule, and most new traders never look at it. An economic calendar lists the data releases and central bank events coming up, with the date, the time, the country or currency, an impact rating, and three numbers: previous, forecast and actual. Forex Factory, Investing.com and most broker platforms have a free one. Set it to your own time zone.
Previous is last period's figure, sometimes revised. Forecast, also called consensus, is the middle of what economists expect this time. Actual is blank until the moment of release, then it fills in. That gap between forecast and actual is what the market reacts to.
Impact ratings are usually shown as colours or icons: high, medium and low. High-impact events are the ones that have a track record of moving a currency hard and fast: rate decisions, inflation, jobs. Low-impact events rarely matter to you. Treat the rating as a guide: a medium release can hit hard when the market is already nervous about that topic.
Why the surprise moves price, not the number
Here is the idea that confuses almost every beginner. A good number does not mean the currency goes up. By the time a release comes out, the forecast is already baked into the price. So the market does not ask "is this number good?" It asks "is this number better or worse than what we expected?"
Say US jobs come in strong at 200,000 new jobs, but the forecast was 260,000. That is a miss, and the dollar can fall on a number that sounds healthy. Flip it: a weak-looking figure that beats an even weaker forecast can lift the currency. The bigger the gap from the forecast, the bigger the move tends to be.
Two more things complicate it. First, revisions: if last month gets revised sharply, that can matter as much as this month's figure. Second, the details: a jobs report has a headline, an unemployment rate and wage growth, and they can disagree. That is one reason the first spike after a release so often turns around once traders read past the headline.
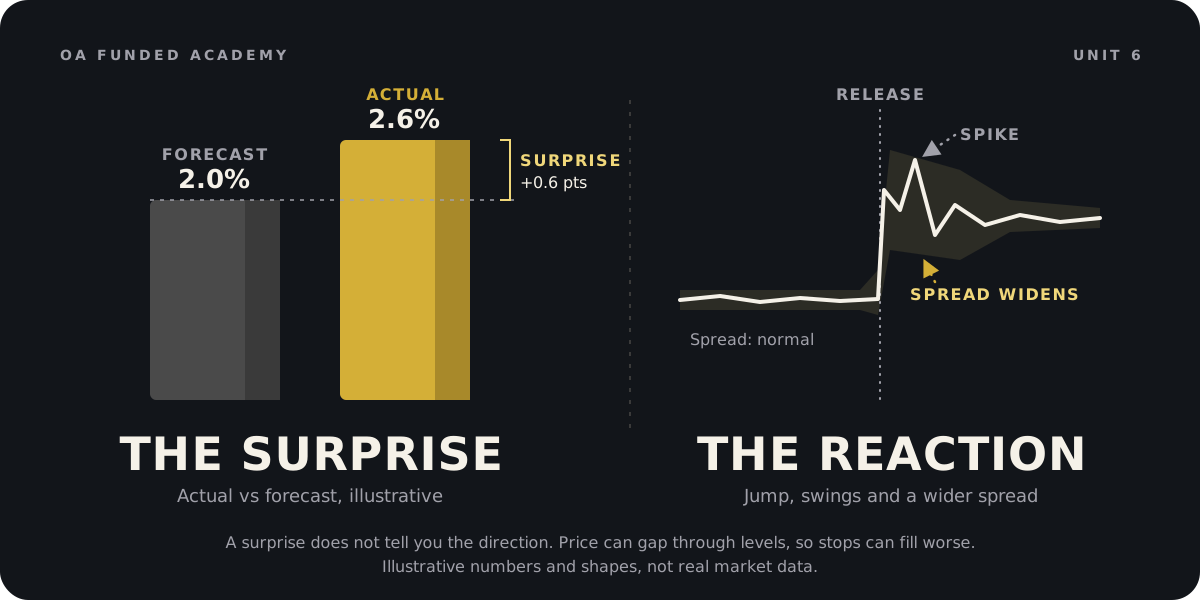
UK inflation is forecast at 3.0%. It comes out at 2.6%, and the previous reading was 2.5%. What reaction fits the usual logic best?
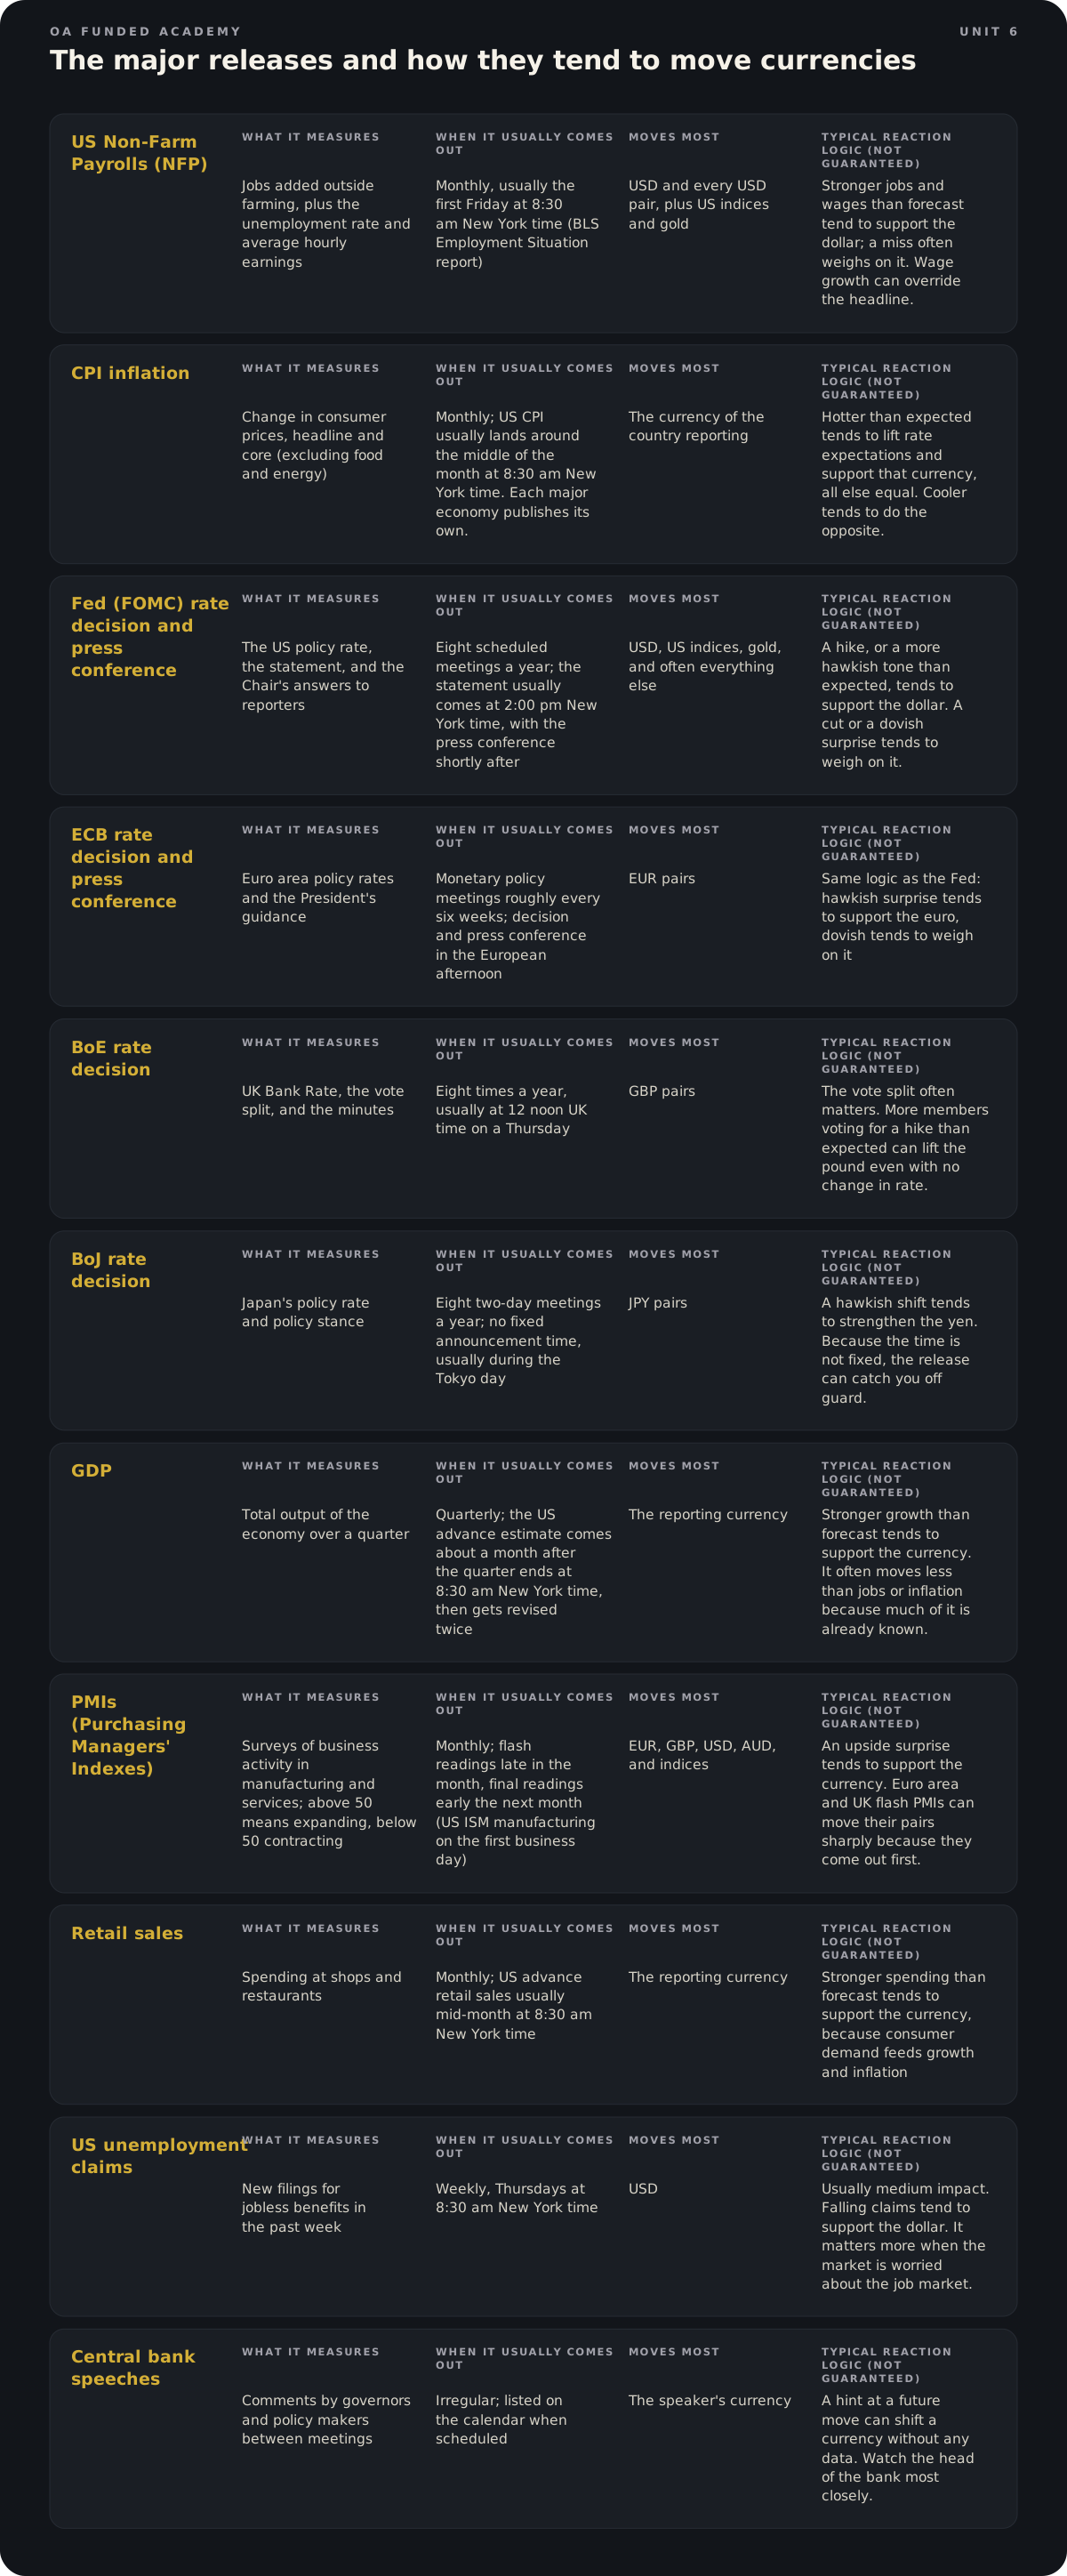
Why central banks sit at the top of the list
Almost every release in that table matters for one reason: it changes what traders think the central bank will do with interest rates. Money tends to flow toward currencies where rates are expected to rise and away from those where they are expected to fall. Jobs and inflation are clues. The rate decision is the verdict.
That is why the decision itself often moves price less than you would think. If everyone expects a hold and the bank holds, the surprise is small. The real move often comes from the statement wording or the press conference, when the governor says something that changes the outlook for the next meeting. If you are new, treat the full conference as part of the event, not just the moment the rate is published.
What news does to price action
You cannot know the direction. You can know how the market tends to behave around a release.
Liquidity thins first. In the minutes before a big number, many traders and liquidity providers step back. Fewer orders sit on the book, so price can move further on less volume. Spreads widen. A pair that normally costs a fraction of a pip can show several pips of spread around NFP or a rate decision, sometimes much more for a moment.
Then price can gap. When the number hits, price may jump from one level to another without trading the prices in between. A stop order becomes a market order once it is touched, and it fills at the next available price. That difference between your stop price and your fill is slippage, and on a release it can be large.
After the jump comes the whipsaw. Price spikes one way, then snaps back the other, sometimes several times in a few minutes. The first move often reverses once the details get read, which is why chasing the initial candle is one of the most expensive habits a new trader can build. If you feel the pull to jump on a big candle at 8:31, name it and keep your hands off until the spread is normal again.
Worked example
Illustrative: slippage on a stop during NFP ($10,000 account)
Illustrative numbers only, not a prediction of any real release. You have $10,000 and risk 0.5% per trade. You bought EUR/USD at 1.0875 before lunch with a stop at 1.0850, 25 pips away. You forgot NFP was at 8:30 am New York time. The number beats the forecast and EUR/USD drops straight through your stop. The first price available after the gap is 1.0832.
- Planned risk: $10,000 × 0.005 = $50. Loss per lot over 25 pips = 25 × $10 = $250. Size = $50 ÷ $250 = 0.20 lots, which is $2 per pip.
- Actual fill: your stop at 1.0850 triggers, but the order fills at 1.0832. Slippage = 1.0850 minus 1.0832 = 18 pips.
- Actual loss: entry 1.0875 minus fill 1.0832 = 43 pips. 43 × $2 = $86.
- Compare: you planned to lose $50, which is 1R. You lost $86, about 1.7R, or 0.86% of the account instead of 0.5%.
- Now run it at 1% risk, which many beginners use: 0.40 lots, $4 per pip. The same 43 pips costs $172, instead of the $100 you thought was the worst case.
Takeaway: A stop limits your loss in normal conditions. During a release it is a request, not a guarantee. The only sure way to avoid release slippage is not to have the position open.
A morning news routine
Five minutes, before you open a single chart.
One: open the calendar, filtered to high and medium impact, set to your own time zone. Two: look at today and tomorrow for the currencies in the pairs you trade. For EUR/USD that means both euro and dollar events. For indices, US data and the Fed matter most for US indices. Three: write each high-impact event and its time on your trading plan or a sticky note on your screen.
Four: decide now, while you are calm, what you will do with each one. There are three choices. Stand aside: no new trades from a set time before to a set time after, for example 15 minutes either side. Flatten: close anything open before the release. Reduce: cut the size if you choose to hold, so that a gapped stop still sits inside the loss you can accept. The decision you make at 7 am is better than the one you make at 8:29 with a position in profit.
Five: set an alert 20 minutes before each event, so the release never catches you mid-trade.
News events on OA Funded
News trading is unrestricted during the evaluation. On a funded account, you may not create or increase exposure from two minutes before to two minutes after a designated high-impact event. You can still hold, close or reduce. Your stop loss and take profit can still execute.
A pending order that triggers inside the window counts as new exposure, so check your resting orders before a big release. The first trade opened in a window is a warning. The next one is a breach.
Allowed is not the same as wise. Spreads, gaps and slippage still apply in the evaluation, and your own window can be wider than the rule.
On an OA Funded funded account, you placed a buy stop order an hour ago. It triggers one minute after a designated high-impact event is released. How is that treated?
Your daily chart is in a clear downtrend. Your 1-hour chart shows a strong bullish candle. Under the three-timeframe method, what does that mean?
Price breaks above resistance at 1.0940, reaches 1.0955, and the daily candle closes at 1.0925. Which statement fits?
Avoid these
Common mistakes.
Mistake
Drawing support and resistance as thin exact lines
Do this instead
Draw zones covering the area where price turned. Expect price to poke past them sometimes.
Mistake
Buying the first candle that pokes through resistance
Do this instead
Use a written rule, such as waiting for a close beyond the zone, and plan for the failed-breakout case too.
Mistake
Calling every pause in a trend a reversal
Do this instead
A trend changes label only when structure breaks, for example the first lower low in an uptrend. Until then, a pause is a pause.
Mistake
Changing timeframe until one agrees with you
Do this instead
Give each timeframe a fixed job before you look. If the higher chart says no, the answer is no.
Mistake
Adding an indicator after every loss
Do this instead
Use one or two tools with a defined job and test them with fixed rules before changing anything.
Mistake
Holding a position into a high-impact release by accident
Do this instead
Check the calendar at the start of every session and set your own no-new-trades window around big events.
Mistake
Writing analysis as a prediction ("EUR/USD will go to 1.0900")
Do this instead
Write it as a condition: if this happens, I will do that, my stop is here, and if not, I do nothing.
Keep the language straight
Quick glossary.
- Market structure
- The pattern of swing highs and swing lows on a chart.
- Swing high / swing low
- A peak with lower prices on both sides, or a dip with higher prices on both sides.
- Regime
- The broad condition of the market: uptrend, downtrend, range or transition.
- Support / resistance
- Zones below or above price where buying or selling has turned price before.
- Role reversal
- When a broken resistance zone later acts as support, or broken support acts as resistance.
- Failed breakout
- Price moves through a zone and then closes back inside it, trapping breakout traders.
- Multi-timeframe analysis
- Reading the same pair on several timeframes, each with a defined job.
- ATR (Average True Range)
- The average size of recent candles, often over 14 periods. Useful for judging stop distance.
- Economic calendar
- A schedule of upcoming economic releases and events, with time, currency and expected impact.
- Flat
- Having no open position.
Lesson check.
6 questions on the whole unit. Score 80% or more to show you have it.
1.A daily GBP/USD chart makes these swing points in order: high 1.2750, low 1.2650, high 1.2700, low 1.2600. How do you label it, and what would change the label?
2.You drew support as one thin line at 1.0800. Price pokes 8 pips below it, then the candle closes back above. What is the best lesson?
3.GBP/USD spikes through resistance to 1.2705, then the daily candle closes back inside the zone. You plan to sell at 1.2680 with a stop at 1.2710. You have $10,000 and risk 0.5%. What size do you use?
4.Under the unit's three-timeframe method, which set of jobs is correct?
5.A designated high-impact US release is due at 8:30am New York time. Which action breaks the OA Funded news window rule?
6.Which of these is a well-written analysis plan?
Practice room
3 activitiesTurn the idea into a decision.
These are fictional learning scenarios. They never place trades or use real money. Complete the required checks to finish this lesson.
Finish this unit
Pass each required activity, then save the current lesson version to your record.
Public lesson Q&A
Ask what is still unclear.
No published questions yet.
Sources and review
- Babypips: Support and Resistance in TradingReviewed 2026-10-31Open (opens in a new tab)
- Babypips: What Is Multiple Time Frame Analysis?Reviewed 2026-10-31Open (opens in a new tab)
- Babypips: What Is a Breakout?Reviewed 2026-10-31Open (opens in a new tab)
- OA Funded Trading Rules (news window)Reviewed 2026-10-31Open (opens in a new tab)
- U.S. Bureau of Labor Statistics: release schedule (Employment Situation, CPI)Reviewed 2026-10-31Open (opens in a new tab)
- Federal Reserve: What is the FOMC and when does it meet?Reviewed 2026-10-31Open (opens in a new tab)
- Federal Reserve: FOMC meeting calendars and statementsReviewed 2026-10-31Open (opens in a new tab)
- European Central Bank: Governing CouncilReviewed 2026-10-31Open (opens in a new tab)
- Bank of England: Interest rates and Bank RateReviewed 2026-10-31Open (opens in a new tab)
- Bank of Japan: What are Monetary Policy Meetings, and when are they held?Reviewed 2026-10-31Open (opens in a new tab)
- U.S. Bureau of Economic Analysis: release schedule (GDP)Reviewed 2026-10-31Open (opens in a new tab)
- U.S. Census Bureau: Advance Monthly Retail SalesReviewed 2026-10-31Open (opens in a new tab)
- Babypips: Why Trade the News?Reviewed 2026-10-31Open (opens in a new tab)
- FXStreet: Analyzing major pairs' reaction to NFP surprisesReviewed 2026-10-31Open (opens in a new tab)