

Unit 05 · 40 min read
Risk, Position Sizing and Drawdown.
Decide what a trade is allowed to cost before you decide how big it is. This unit teaches risk per trade, sizing from your stop distance, R-multiples, the maths of drawdown and recovery, and how to plan for losing streaks so one bad week does not undo months of work.
- Level
- Beginner
- Revision
- mentor-2026-10
- Access
- Public
By the end, you can
- Choose a fixed risk per trade as a percentage of the account and convert it to dollars
- Calculate position size from dollar risk, stop distance and pip value
- Use R-multiples to compare trades and to calculate simple expectancy
- Measure drawdown from peak to trough and calculate the gain needed to recover
- Estimate how long losing streaks can be for a given win rate
- Write personal guardrails: daily stop, risk reduction after drawdown, and a pass rule
Size is the last decision: risk first, then the formula
Here is how most beginners place a trade. They see a setup, feel good about it, pick a lot size that feels right, and then put the stop somewhere that does not cost too much. That is backwards, and it is why their stops keep getting hit by normal noise.
Here is how I want you to do it. First, find the price where your trade idea is wrong. That is your stop. Second, decide how many dollars you are willing to lose if that price is reached. That is your risk. Only then, third, work out the position size that makes those two numbers fit together. If the size comes out smaller than you hoped, that is the answer. If it comes out smaller than the smallest size the platform allows, you pass on the trade.
This order matters because the market does not care where you need your stop to be. It only cares where the idea is wrong. Your job is to fit your size to the market, not the other way round.
Risk per trade is the amount you will lose if your stop is hit. Most experienced traders express it as a percentage of the account, so it scales with the account instead of staying fixed.
For learning, I suggest somewhere between 0.25% and 1% of the account per trade, with 0.5% as a sensible middle. On a $10,000 account, 0.5% is $50. On a $25,000 account, 0.5% is $125 and 0.4% is $100. These may feel small. That is the point. Small risk is what lets you survive long enough to find out whether your method works.
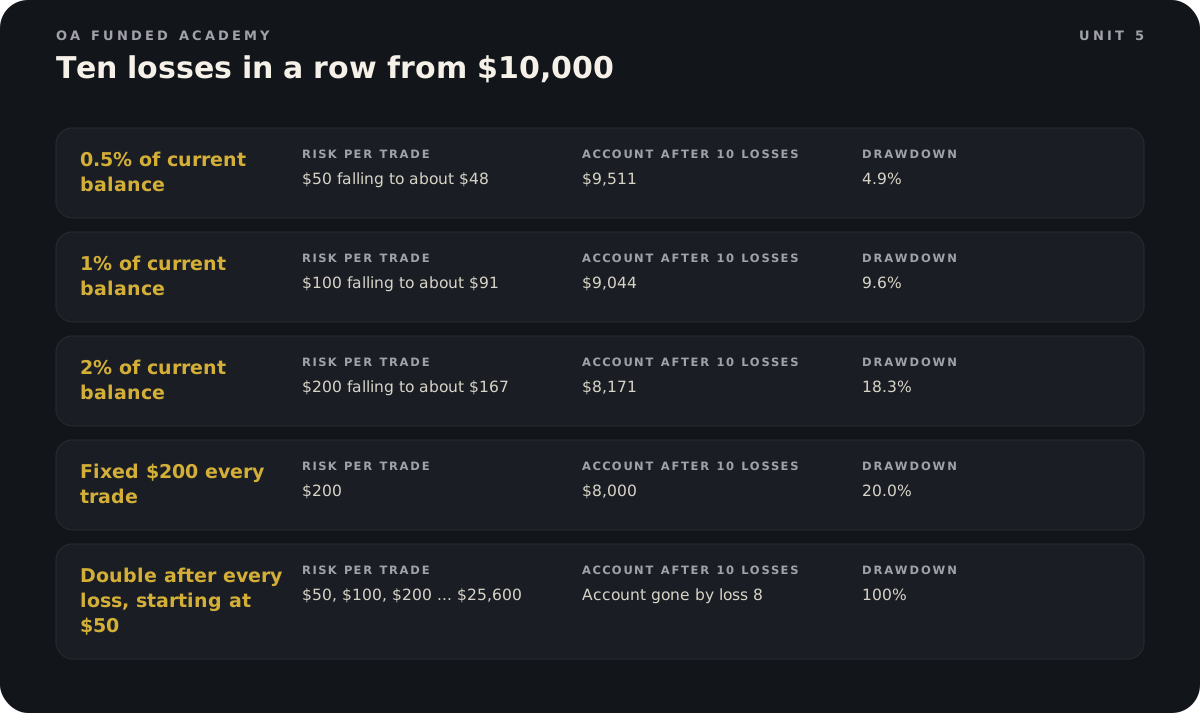
You will see people online say 2% is standard. On a $10,000 account that is $200 a trade, and ten losses in a row would cost about 18% of the account. We will look at why that matters in a moment. Two percent is not insane, but it is the top of the range, not the starting point.
One more definition. When this unit says stop distance, it means the number of pips between your entry and your stop. When it says pip value, it means the dollars per pip for one standard lot, which you learned to calculate in Unit 4: $10 for EUR/USD, and 1,000 yen divided by the price for USD/JPY.
There is one formula to remember: position size in lots = dollar risk ÷ (stop distance in pips × pip value per lot).
The bit in brackets is the loss per lot: how much one standard lot would lose if the stop is hit. Divide your dollar risk by that, and you get how many lots you can afford.
Two rules go with it. Always round down, never up. And leave a small allowance for costs and slippage, because a stop can fill a pip or two worse in a fast market, and commission is charged win or lose.
Worked example
Sizing a EUR/USD trade ($10K account)
You have $10,000. Your rule is 0.5% risk per trade. Your setup on EUR/USD says the idea is wrong 20 pips below your entry. For practice, assume commission of $7 per lot round turn and allow 1 pip for slippage.
- Dollar risk: $10,000 × 0.005 = $50.
- Loss per lot at the stop: 20 pips × $10 = $200.
- Raw size: $50 ÷ $200 = 0.25 lots.
- Check the total cost at 0.25 lots: stop $50, plus slippage 1 pip × $2.50 = $2.50, plus commission 0.25 × $7 = $1.75. Total $54.25. That is over budget.
- Trim to 0.23 lots: stop 20 × $2.30 = $46.00, slippage $2.30, commission $1.61. Total $49.91. Inside the $50 budget.
- Enter 0.23 lots, stop 20 pips away.
Takeaway: Dollar risk and stop distance decide the size. Then trim a little so costs and slippage fit inside the budget.
Worked example
Sizing a USD/JPY trade ($25K account)
You have $25,000 and risk 0.4% per trade. USD/JPY is at 150.00 and your idea is wrong 35 pips away. Same practice commission of $7 per lot.
- Dollar risk: $25,000 × 0.004 = $100.
- Pip value per lot: 1,000 yen ÷ 150.00 = $6.67.
- Loss per lot at the stop: 35 × $6.67 = $233.33.
- Raw size: $100 ÷ $233.33 = 0.4286 lots. Round down to 0.42.
- Check: stop 0.42 × $233.33 = $98.00, plus commission 0.42 × $7 = $2.94. Total $100.94. Slightly over.
- Trim to 0.41: stop $95.67, commission $2.87, total $98.54. Inside budget with a little room for slippage.
- Now imagine your stop needs to be 70 pips instead of 35. Loss per lot doubles to $466.67, so size halves to about 0.21 lots. Same $100 risk.
Takeaway: When the stop gets wider, the size gets smaller. Risk in dollars stays the same.
You risk $50 per trade. Yesterday's EUR/USD trade had a 20-pip stop and you used 0.25 lots. Today the stop needs to be 40 pips. What size keeps the risk the same, before costs?
R: a simple way to measure every trade
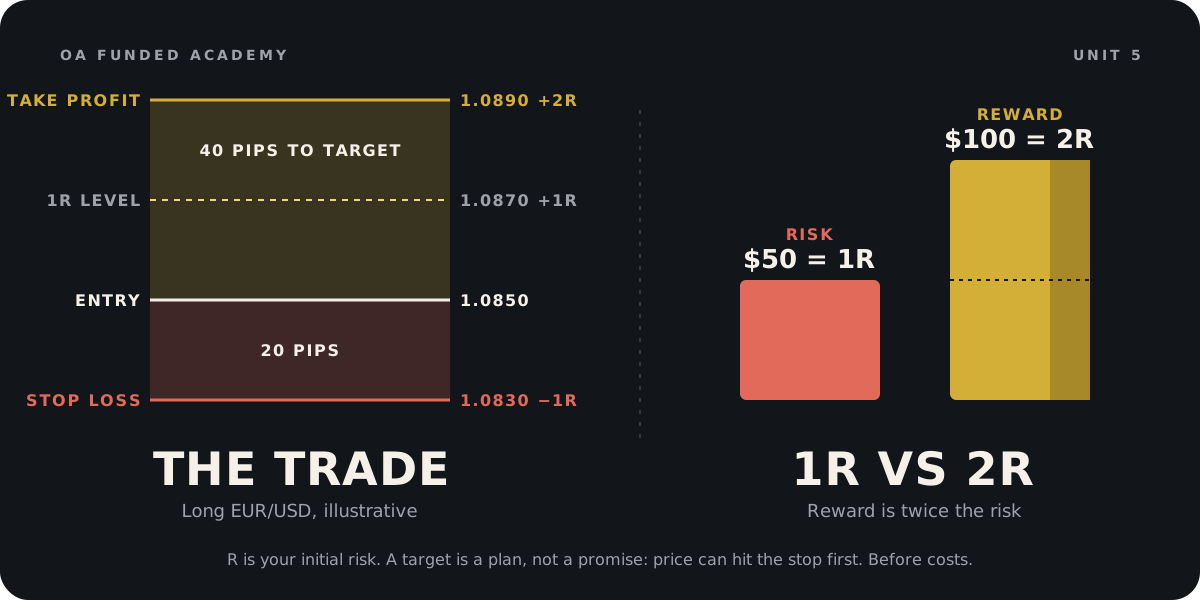
R stands for your initial risk on a trade. If you risked $50, then 1R is $50. A trade that loses the full stop is -1R. A trade that makes $100 is +2R. A trade that makes $25 is +0.5R.
Thinking in R does two useful things. First, it lets you compare trades on different account sizes or with different stop distances on equal terms. Second, it takes some of the sting out of dollar figures. A -1R loss is a planned, budgeted event. A -3R loss on a trade where you meant to risk 1R is a process failure, and R makes that impossible to hide.
Expectancy is the average R you would expect per trade over many trades, if your past results are a fair guide. The formula is: (win rate × average win in R) minus (loss rate × average loss in R).
Worked example
Expectancy in R (illustrative numbers)
Imagine a tested method where 40% of trades win an average of +2R and 60% lose an average of -1R. Costs average 0.1R per trade. These numbers are for practice only. They are not a typical or expected result.
- Winning side: 0.40 × 2R = 0.80R.
- Losing side: 0.60 × 1R = 0.60R.
- Before costs: 0.80R minus 0.60R = +0.20R per trade.
- After costs: 0.20R minus 0.10R = +0.10R per trade.
- Now change one thing. If average wins shrink to +1.5R because you keep taking profit early, the winning side is 0.40 × 1.5 = 0.60R. Before costs the edge is 0.60 minus 0.60 = 0. After costs it is -0.10R per trade.
Takeaway: Win rate alone tells you nothing. A 40% win rate can have a positive average, and a habit of cutting winners early can turn it negative.
Drawdown and why recovery is harder than the fall
Drawdown is how far your account has fallen from its highest point, called the peak, to its lowest point since, called the trough. It is usually written as a percentage of the peak.
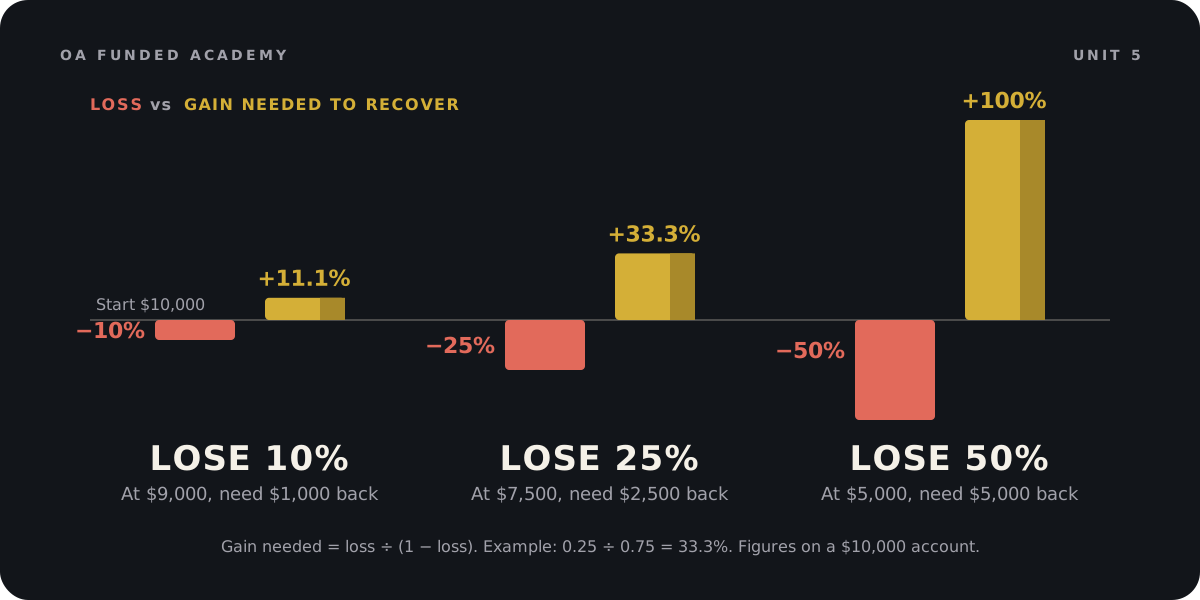
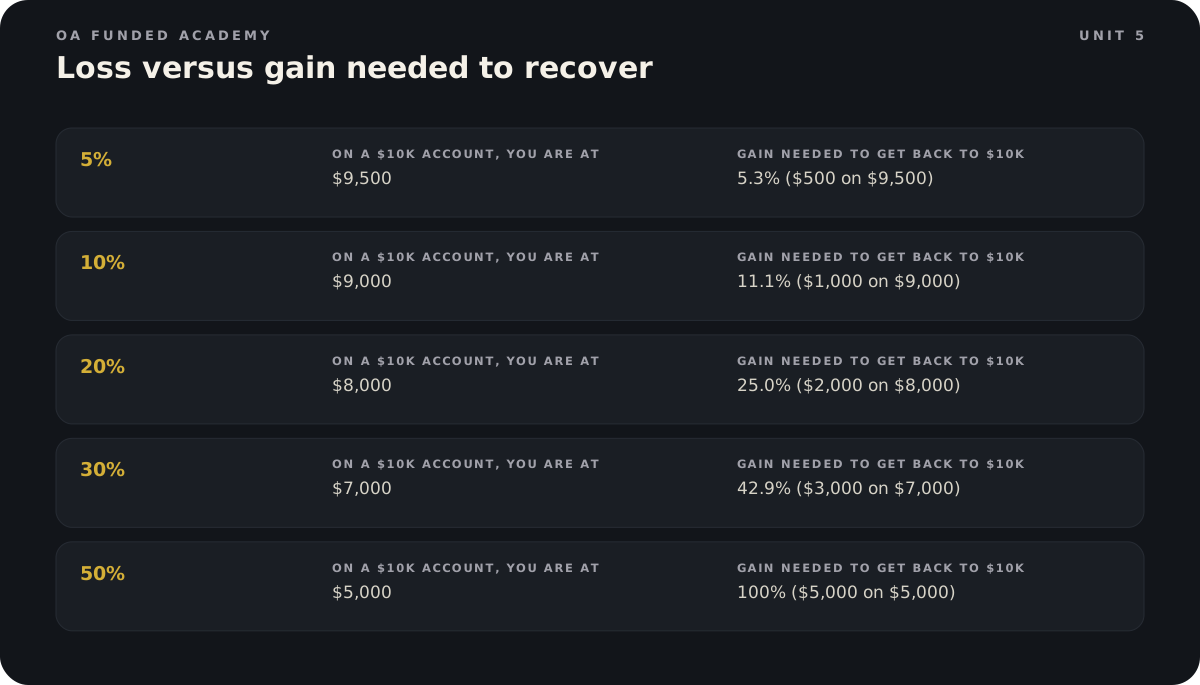
Here is the part that surprises people. Losses and gains are not symmetrical. If you lose 10%, you need 11.1% to get back. Lose 20% and you need 25%. Lose 50% and you need 100%, which means doubling what is left. The formula is: gain needed = loss ÷ (1 minus loss). For a 30% loss that is 0.30 ÷ 0.70 = 42.9%.
This is why risk control matters more than finding winners. Small drawdowns are recoverable with ordinary trading. Big ones need extraordinary results, and needing extraordinary results is what pushes traders into the oversized, emotional trades that make things worse.
Worked example
Measuring a real drawdown ($10K account)
Your account starts at $10,000, climbs to $10,600 over three weeks, then falls to $9,850 before recovering.
- The peak is $10,600, not the $10,000 you started with. Drawdown is always measured from the highest point.
- Drop from peak to trough: $10,600 minus $9,850 = $750.
- Drawdown: $750 ÷ $10,600 = 7.08%.
- Gain needed to reach the peak again: $750 ÷ $9,850 = 7.61%.
- Note that the account is only 1.5% below where it started. That is why traders who only compare to their starting balance underestimate how hard the last month really was.
Takeaway: Track drawdown from the peak. It tells you the truth about how much ground you have lost.
Losing streaks are normal. Plan for them.
Even a method with a positive average will have runs of losses. They are not a sign that something broke. They are what randomness looks like. If your win rate is 45%, the chance of any particular five trades all losing is 0.55 × 0.55 × 0.55 × 0.55 × 0.55, which is about 5%. That sounds rare, but over a few hundred trades it will happen many times. A rough rule of thumb puts the longest losing run you should expect in 100 trades at around 7 or 8 with a 45% win rate.
So ask yourself: what does 8 losses in a row do to my account? At 0.5% risk, about 3.9%. At 1%, about 7.7%. At 2%, about 14.9%. At 5%, about 33.7%, which needs a 51% gain just to get back. The streak is the same. Your risk setting decides whether it is a bad week or the end of the account.
The feeling during a streak is the dangerous part. After three or four losses, most traders feel an urge to win it back fast, either by trading more or trading bigger. That urge is normal and you will feel it. Plan for it now, while you are calm. On OA Funded, doubling up after losses in a martingale style is banned, but the reason to avoid it is the same everywhere: it turns a normal streak into a catastrophic one.
An account falls from $10,000 to $8,000. What percentage gain does it need to get back to $10,000?
Your personal guardrails
Write these down before your next session. They are your rules, set lower than any limit a platform or firm gives you, so you have a buffer.
Risk per trade: a fixed percentage, for example 0.5%. Daily stop: a maximum loss for the day, for example 3 losing trades or 1.5% of the account, whichever comes first. Drawdown step-down: if the account falls 4% from its peak, halve risk per trade until you have recovered half of that. Pass rule: if the size needed is below the platform minimum, or the stop would have to be squeezed to fit, you do not take the trade.
Firm limits are a different thing. If you trade a prop evaluation, it will have its own loss limits, and on OA Funded those are covered in Unit 6 and Unit 8. Treat those as the cliff edge, and keep your personal guardrails well back from it.
Which order is correct when planning a trade?
Avoid these
Common mistakes.
Mistake
Choosing the lot size first and placing the stop where it fits
Do this instead
Put the stop where the idea is wrong, set dollar risk, then calculate size. Pass if it does not fit.
Mistake
Widening the stop during the trade without reducing size
Do this instead
Widening a stop is a decision to risk more. Decide stop distance before entry and leave it, or close and replan.
Mistake
Doubling size after a loss to win it back
Do this instead
Keep risk fixed. A doubling sequence turns an ordinary losing streak into a wiped account, and on OA Funded martingale trading is banned.
Mistake
Rounding position size up
Do this instead
Always round down. A rounded-up size means every loss is bigger than your plan.
Mistake
Measuring drawdown from the starting balance
Do this instead
Measure from the highest point the account reached. That is the ground you actually have to win back.
Mistake
Judging a method by its win rate
Do this instead
Look at expectancy: win rate and average win and loss in R together, after costs.
Mistake
Using a firm or platform limit as your daily risk budget
Do this instead
Set a personal daily stop well below any external limit, so a bad fill or one extra loss does not take you over the edge.
Mistake
Abandoning a tested plan after five losses
Do this instead
Check whether the streak is within what your win rate predicts before changing anything. Review the process, not just the result.
Keep the language straight
Quick glossary.
- Risk per trade
- The amount you lose if the stop is hit, usually set as a percentage of the account.
- Stop distance
- The number of pips between your entry price and your stop price.
- Position sizing
- Choosing the trade size so that a stop-out costs exactly your planned risk or less.
- Invalidation
- The price at which your reason for the trade is no longer true. Your stop belongs there.
- R-multiple
- A trade result divided by its initial risk. -1R is a full planned loss; +2R is twice the risk in profit.
- Expectancy
- The average R per trade a method has produced, from win rate and average win and loss.
- Drawdown
- The fall in account value from its highest point to a later low, usually as a percentage of the peak.
- Losing streak
- A run of consecutive losing trades. Normal even for methods with a positive average.
- Martingale
- Increasing size after each loss to recover it in one trade. Very high risk of ruin.
Lesson check.
6 questions on the whole unit. Score 80% or more to show you have it.
1.You have a $25,000 account and risk 0.5% per trade. Your EUR/USD idea is wrong 25 pips from entry. What size do you trade, before costs?
2.You have a $10,000 account and risk 0.5%. USD/JPY is at 125.00 and your stop is 25 pips away. What size do you trade, before costs?
3.An account starts at $10,000, climbs to $10,800, then falls to $9,720. What is the drawdown, and what gain is needed to get back to the peak?
4.Illustrative numbers only: a method wins 50% of trades at an average of +1.2R and loses 50% at an average of -1R. Costs average 0.15R per trade. What is the expectancy after costs?
5.You planned to risk $80 on a trade. During the trade you widened your stop twice, and it closed for a $240 loss. How should you record it?
6.Two traders hit the same run of 8 losses in a row. One ends about 3.9% down, the other about 14.9% down. What made the difference?
Practice room
3 activitiesTurn the idea into a decision.
These are fictional learning scenarios. They never place trades or use real money. Complete the required checks to finish this lesson.
Position-size sandbox
Cash risk
$50.00
Position size
0.25 lots
Learning estimate only. Verify contract size, quote-currency conversion and costs in the instrument specification before any order.
Finish this unit
Pass each required activity, then save the current lesson version to your record.
Public lesson Q&A
Ask what is still unclear.
No published questions yet.
Sources and review
- Babypips: Position Size Calculator and worked examplesReviewed 2026-10-31Open (opens in a new tab)
- Investopedia: Understanding DrawdownsReviewed 2026-10-31Open (opens in a new tab)
- Reddit r/Forex: 4 consecutive losses, how do you deal with losing streaks?Reviewed 2026-10-31Open (opens in a new tab)
- Reddit r/Trading: How do you handle position sizing after a losing streak?Reviewed 2026-10-31Open (opens in a new tab)
- OA Funded Trading Rules (martingale)Reviewed 2026-10-31Open (opens in a new tab)